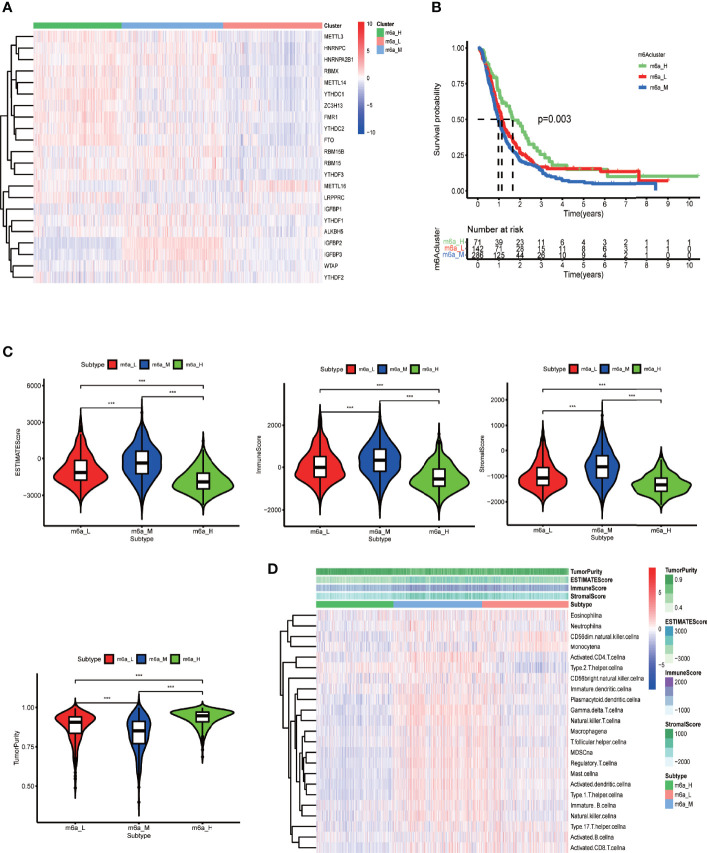
Figure 4.
Clustering based on m6A-regulating genes and TME scores of different clusters. (A) Clustering heat map of TCGA and CGGA samples by running the ConsensusClusterPlus package. (B) Survival curves of different clusters based on the survival package. (C) Violin plots of TME scores of different clusters. The TME scores include ESTIMATE score, immune score, stromal score, and tumor purity. (D) Heat map of TME and specific immune cell content in different clusters obtained by ssGSEA analysis. The abscissa represents the sample name, and the ordinate represents TME scores and different immune cells. ***p < 0.001, **p < 0.01 *p < 0.05, ns: p > 0.05.

