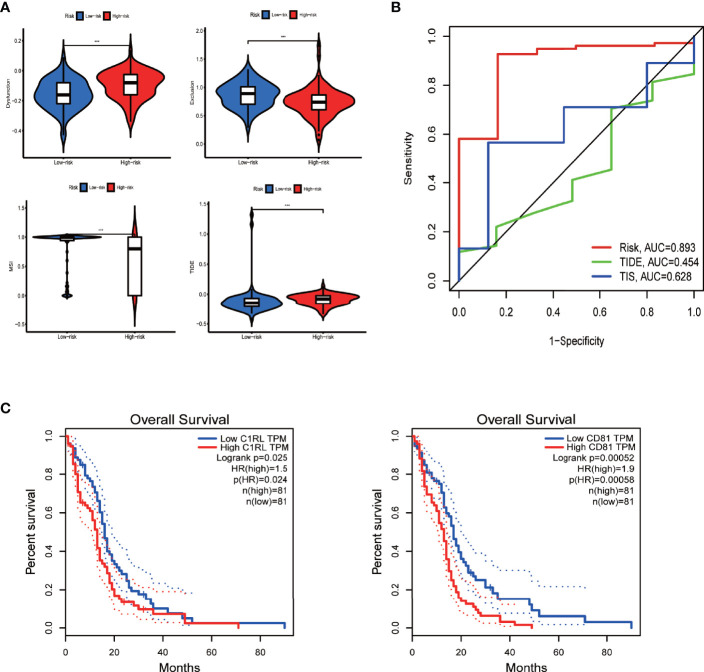
Figure 8.
Efficacy prediction of immunotherapy, model comparison, and survival analysis of model genes via GEPIA. (A) Violin plots showing the TIDE-score analysis of different risk groups in the TIDE database. (B) Three-year ROC curve of different prognostic models based on the pROC package. (C) Survival curves of model genes significantly associated with survival in GEPIA. ***p < 0.001, **p < 0.01 *p < 0.05, ns: p > 0.05.

