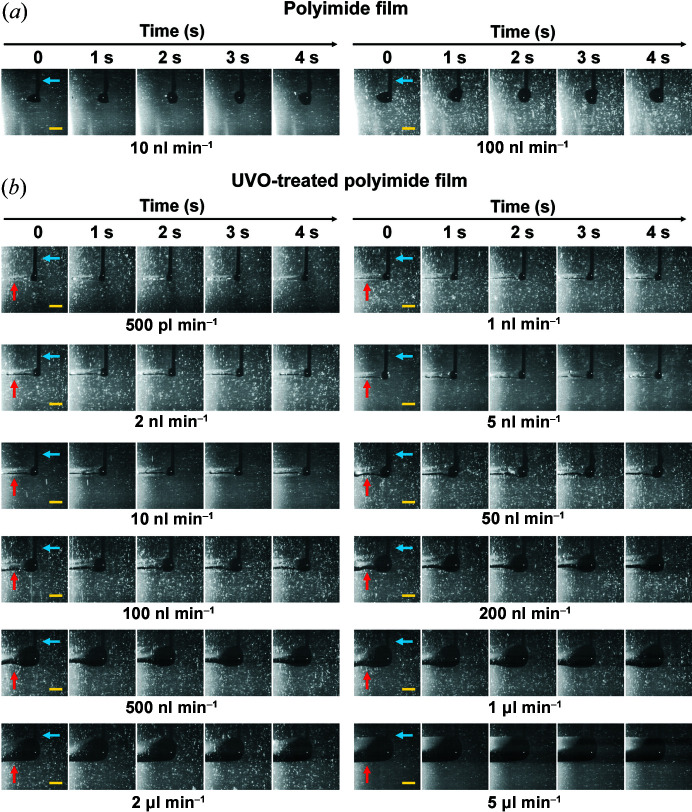
Figure 2.
Sample injection experiment on polyimide film. (a) Snapshots of sample injection on the polyimide film at flow rates of 10 and 100 nl min−1 during vertical scanning. (b) Snapshots of sample injection on the UVO-treated polyimide film at flow rates of 0.5, 1, 2, 5, 10, 50, 100, 200, 500, 1000, 2000 and 5000 nl min−1 during vertical scanning. The injection needle and deposited sample are indicated by blue and red arrows, respectively. Scale bar indicates 500 µm.

