
Figure 1 |. Temporal dynamics of anti-SARS-CoV-2 antibodies in vaccinated participants.
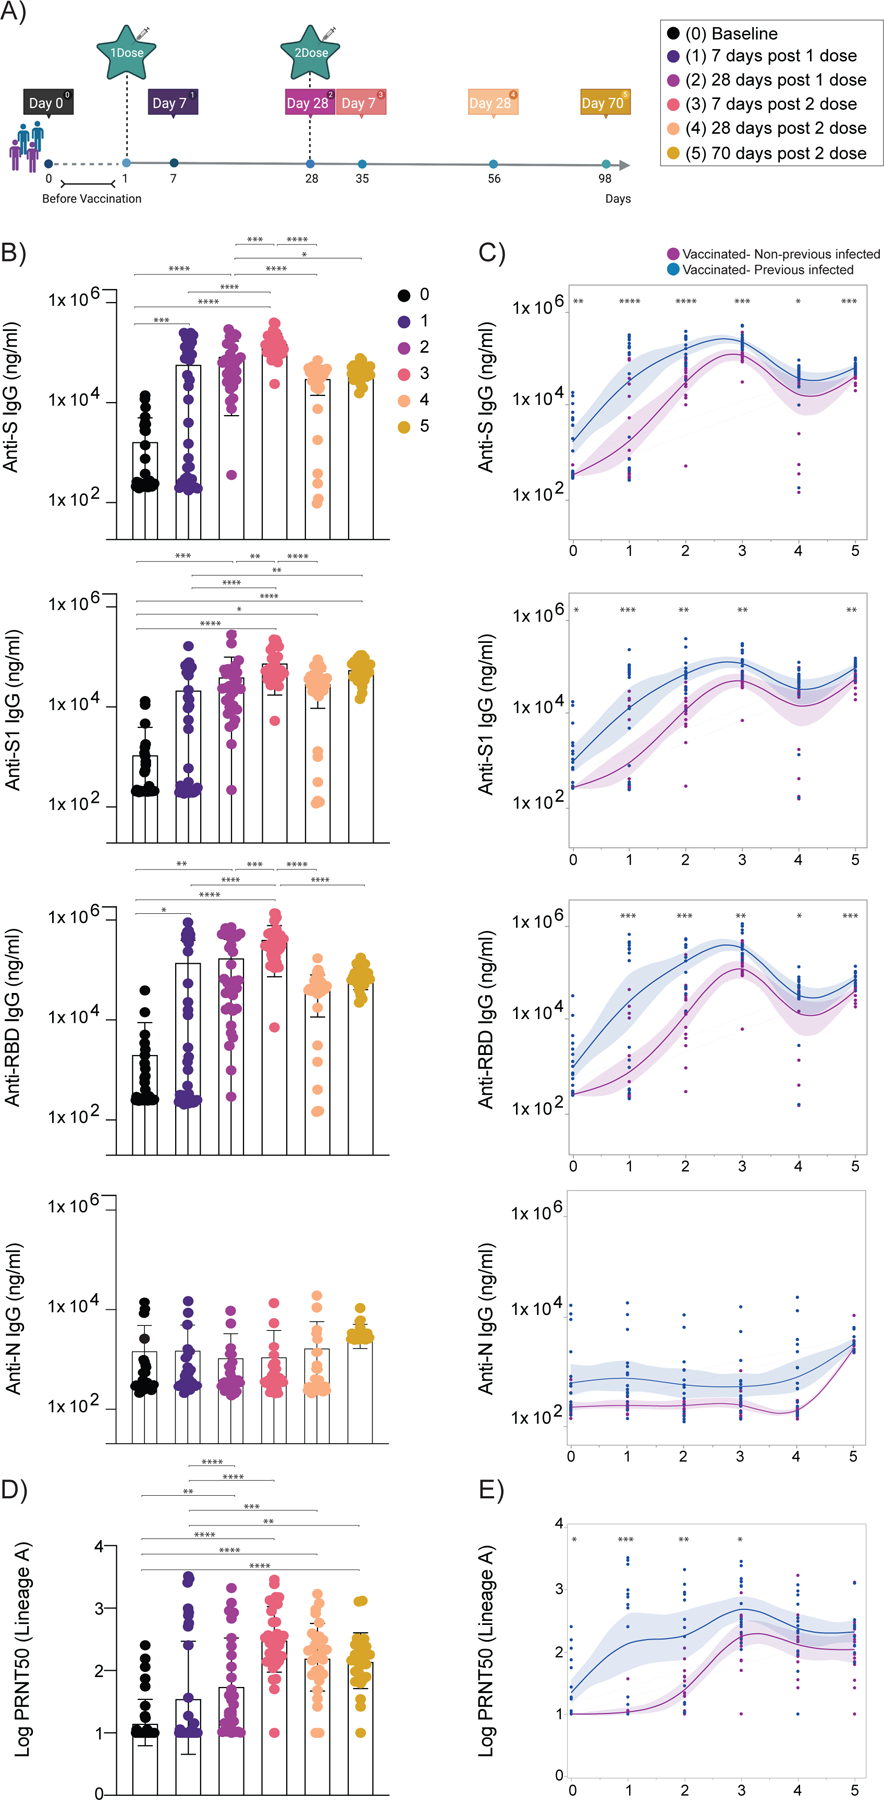
a, Cohort timeline overview indicated by days post SARS-CoV-2 mRNA vaccination. HCW participants received 2 doses of the mRNA vaccine and plasma samples were collected as indicated. Baseline, prior to vaccination; Time point (TP) 1, 7 days post 1 dose; TP 2, 28 days post 1 dose; TP 3, 7 days post 2 dose; TP 4, 28 days post 2 dose; TP 5, 70 days post 2 dose. Participants were stratified based on previous exposure to SARS-CoV-2 (purple: Vaccinated- uninfected; blue: Vaccinated-Previously infected). b, c, Plasma reactivity to S protein, RBD and Nucleocapsid measured over time by ELISA. b, Anti-S, Anti-S1, Anti-RBD and Anti-N IgG levels. c, Anti-S, Anti-S1, Anti-RBD and Anti-N IgG comparison in vaccinated participants previously infected or not to SARS-CoV-2. S, spike. S1, spike subunit 1. RBD, receptor binding domain. N, nucleocapsid. d, e, Longitudinal neutralization assay using wild-type SARS-CoV-2, ancestral strain (WA1, USA). d, Neutralization titer (PRNT50) over time. b, d, Significance was assessed by One-way ANOVA corrected for multiple comparisons using Tukey’s method. Boxes represent mean values ± standard deviations. e, Plasma neutralization capacity between vaccinated participants previously infected or not to SARS-CoV-2. c, e, Longitudinal data plotted over time continuously. Regression lines are shown as blue (previously infected) and purple (uninfected). Lines indicate cross-sectional averages from each group with shading representing 95% CI and are coloured accordingly. Significance was accessed using unpaired two-tailed t-test. TP, vaccination time point (TP0, n=37; TP1, n=35; TP2, n=30; TP3, n=34; TP4, n=31; TP5, n=27). Each dot represents a single individual. ****p < .0001 ***p < .001 **p < .01*p < .05.