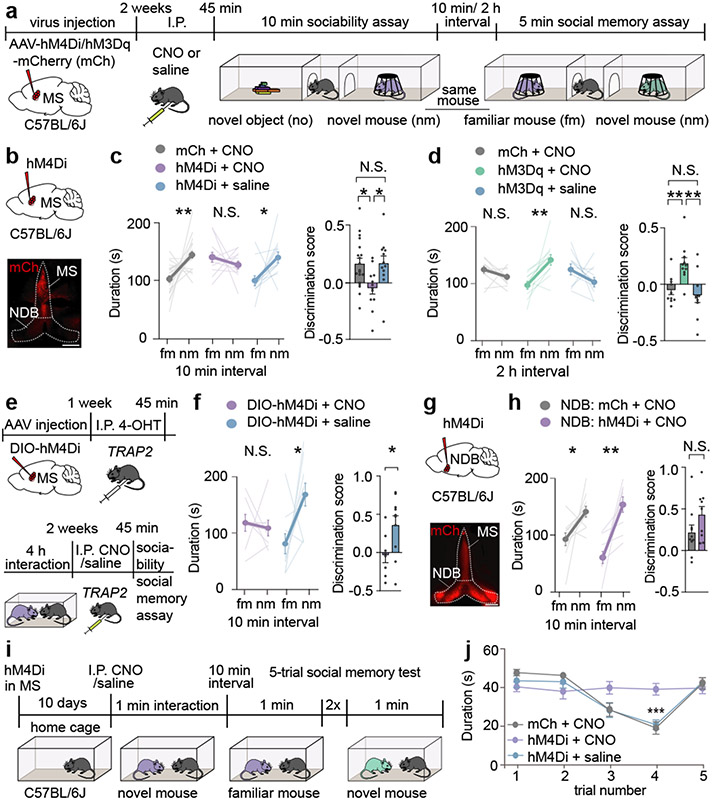
Fig. 1∣. Chemogenetic manipulation of the medial septum bidirectionally regulates social memory.
a, Experimental timeline of 3-chamber tests. b, Schematic and representative image of medial septum (MS) injection site. Scale bar, 500 μm. c, d, Duration subjects spent in chamber with familiar mouse (fm) or novel mouse (nm) (left graph) and discrimination scores (right graph) (c: F2, 40=4.666, P=0.0151; mCh: n=19, hM4Di; n=12. d: F2, 28=8.585, P=0.0012; mCh: n=10, hM3Dq: n=11). e, Timeline of TRAP2 experiment. f, Duration in chamber with fm or nm (left) and discrimination scores (right) (t7=2.594, P=0.0357; CNO: n=8, saline: n=10). g, Schematic and hM4Di expression in nucleus of the diagonal band (NDB). Scale bar, 500 μm. h, Duration in chamber with fm or nm (left) and discrimination scores (right) (t17=1.61, P=0.1259; mCh: n=10, hM4Di: n=9). i, Timeline of 5-trial social memory test. j, Duration of direct interaction (F27, 108=2.478, P=0.0005, n=10). (c: hM4Di+CNO, mCh+CNO duration; d, f, h: duration; f: discrimination scores): two-tailed paired Student’s t-test. (c: hM4Di+saline duration): two-tailed Wilcoxon signed rank test, (c, d: discrimination scores): one-way ANOVA with Tukey’s post-hoc test, (h: discrimination scores): two-tailed unpaired Student’s t-test. (j) two-way ANOVA with Tukey’s post-hoc test. N.S.=not significant, *P < 0.05, **P < 0.01, ***P < 0.001. Error bars denote s.e.m.

