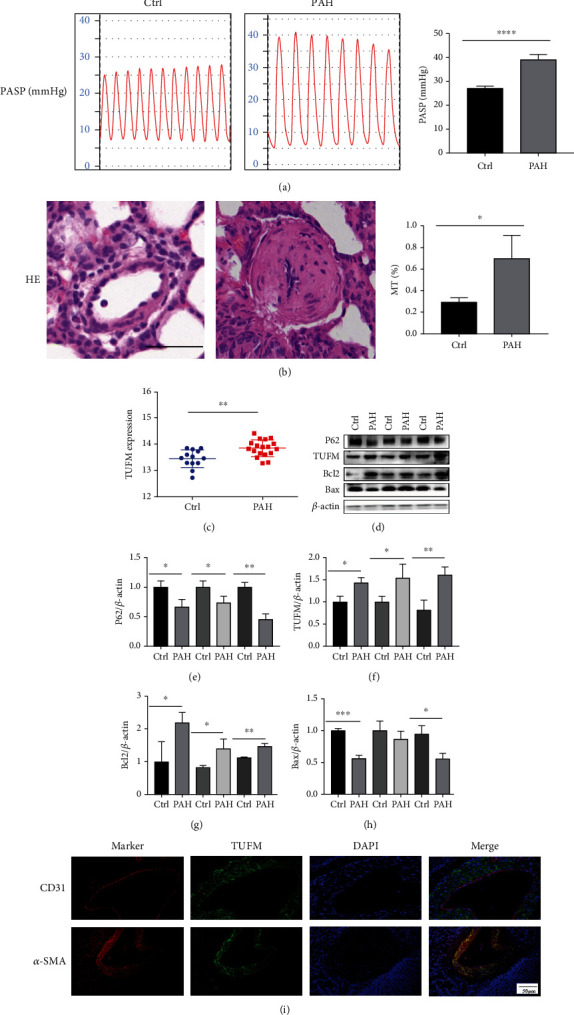
Figure 1.

Monocrotaline-induced pulmonary hypertension and the expression of TUFM in the pulmonary hypertension and normal control rats. (a) 28 days after monocrotaline induction of the model, the pulmonary arterial systolic pressure measured using the system. (b) Hematoxylin and eosin (HE) staining for the pulmonary arterioles of normal control and monocrotaline-induced PAH model. Scale bar: 50 μm. (c) Differential expression of TUFM from GSE15197 database analysis. (d) The initial test for TUFM, mitophagy marker P62, and apoptosis indicator Bax and Bcl2 expression in the normal control and monocrotaline-induced PAH rat. (e–h) Densitometry data represent the intensity of the quantitative expression of P62, TUFM, Bcl2, and Bax proteins. (i) Immunofluorescence chemistry examination indicated the location profile of TUFM in pulmonary arteries. Scale bar: 50 μm. Ctrl: normal control; PAH: pulmonary arterial hypertension. Data is presented as mean ± SD. n = 6 each group. ∗P < 0.05 vs. Ctrl group, ∗∗P < 0.01, and ∗∗∗P < 0.001.
