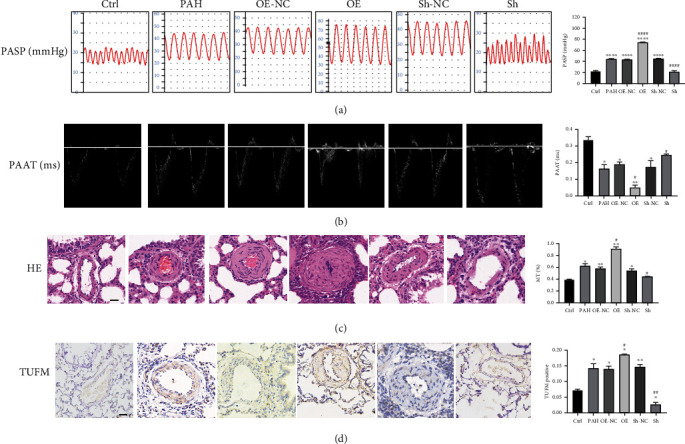
Figure 2.

Characterization of different treated rats. (a) Images and ratio comparison of pulmonary arterial systolic pressure (mmHg). (b) Pulmonary artery accelerated time (ms). (c) Hematoxylin and eosin stain of paraffin slice. (d) Immunohistochemistry for TUFM in each group. Scale bar: 50 μm; Ctrl: normal control; PAH: pulmonary arterial hypertension; OE-NC: overexpression negative control; OE: overexpression of TUFM; Sh-NC: Sh-TUFM negative control; Sh: Sh-TUFM group; PASP: pulmonary arterial systolic pressure; PAAT: pulmonary arterial accelerated time; HE: hematoxylin and eosin stain. Data are presented as mean ± SD. n = 6 each group. ∗P < 0.05 vs. Ctrl group, ∗∗P < 0.01, and ∗∗∗P < 0.001; #P < 0.05 vs. PAH group and ####P < 0.0001.
