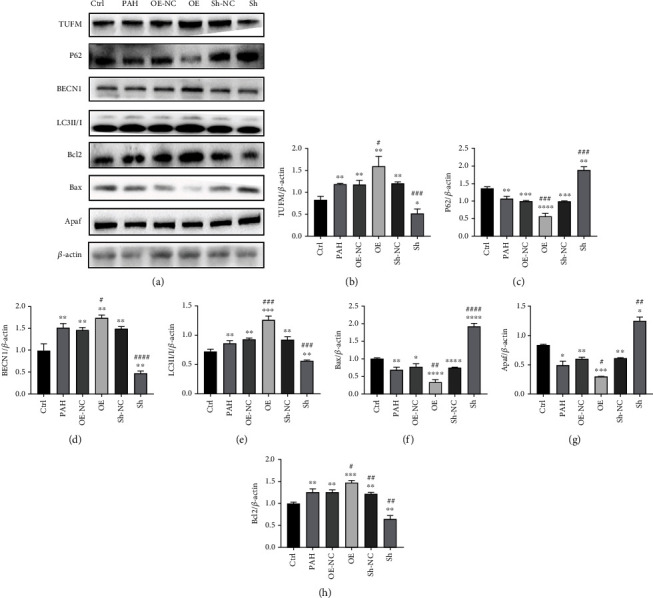
Figure 3.

Expressions of TUFM and the autophagy indicators in different treated groups. (a) Western blot of TUFM, LC3II/I, Bax, Bcl2, BECN1, P62, and Apaf expression in each group as indicated. (b–h) Densitometry data represent the intensity of each group. Ctrl: normal control; PAH: pulmonary arterial hypertension; OE-NC: overexpression negative control; OE: overexpression of TUFM; Sh-NC: Sh-TUFM negative control; Sh: Sh-TUFM group. Data is presented as mean ± SD. n = 6 each group. ∗P < 0.05 vs. Ctrl group, ∗∗P < 0.01, ∗∗∗P < 0.001, and ∗∗∗∗P < 0.0001; #P < 0.05 vs. PAH group, ##P < 0.01, ###P < 0.001, and ####P < 0.0001.
