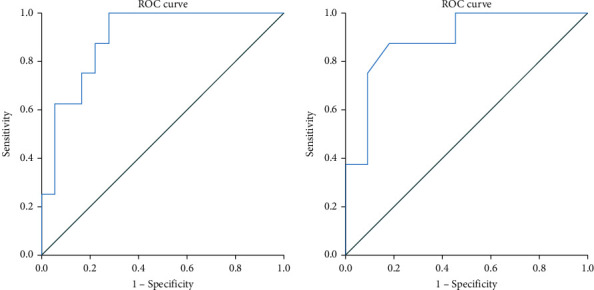
Figure 1.

Receiver operating characteristics (ROC) plots illustrating the area under the curve (AUC) model for the prediction of MAS defined by the 2016 MAS classification criteria. (a) Ferritin/ESR ratio N = 26, AUC = 0.896 (95% CI: 0.78-1.00), p = 0.002. (b) MS score N = 19, AUC = 0.892 (95% CI: 0.74-1.00), p = 0.004.
