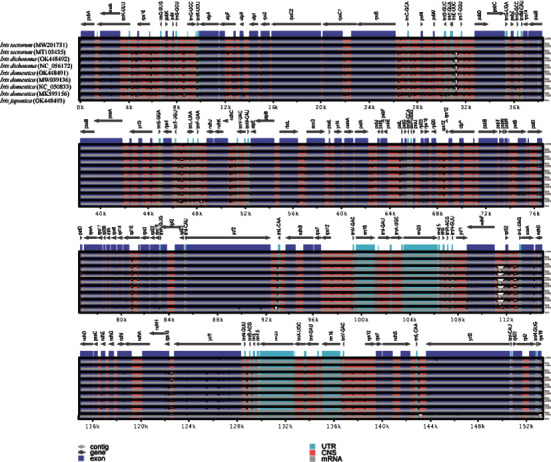
Figure 6.

Alignment of the complete CP genomes of nine Iris species with the reference I. tectorum (MW201731) using the mVISTA program. White plots show various regions among species. The genomic regions are color coded. The vertical scale represents the percent identity ranging from 50% to 100%.
