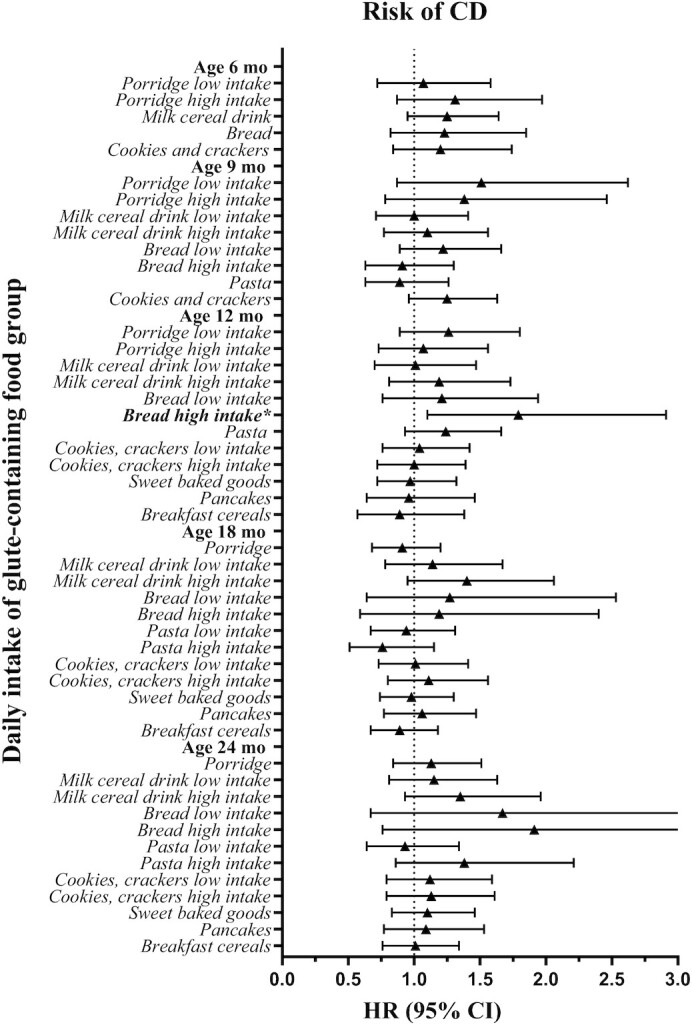
FIGURE 3.

Summary plot of the estimated HRs and their related 95% CIs by Cox regressions of the association between daily intake of gluten-containing food groups assessed from 3-d food records at ages 6–24 mo and CD (n = 242) in Swedish children (n = 2088) at genetic risk. Depending on the percentage of consumers (having an intake >0 g/d) at each age, intake variables were modeled as binary (if ≤50% were consumers; 0 g/d, >0 g/d) or categoric (if >50% were consumers; 0 g/d, median intake or less in participants without CDA or CD at the visit, greater than median intake in participants without CDA or CD at the visit) to represent no, low, and high intake. Included covariates in the analyses were human leucocyte antigen risk group, sex, having a parent or sibling with CD, and energy and gluten intake assessed by the respective food record. *Statistically significant result. Supplemental Table 4A–E summarizes detailed results. CD, celiac disease; CDA, celiac disease autoimmunity.
