
FIGURE 2.
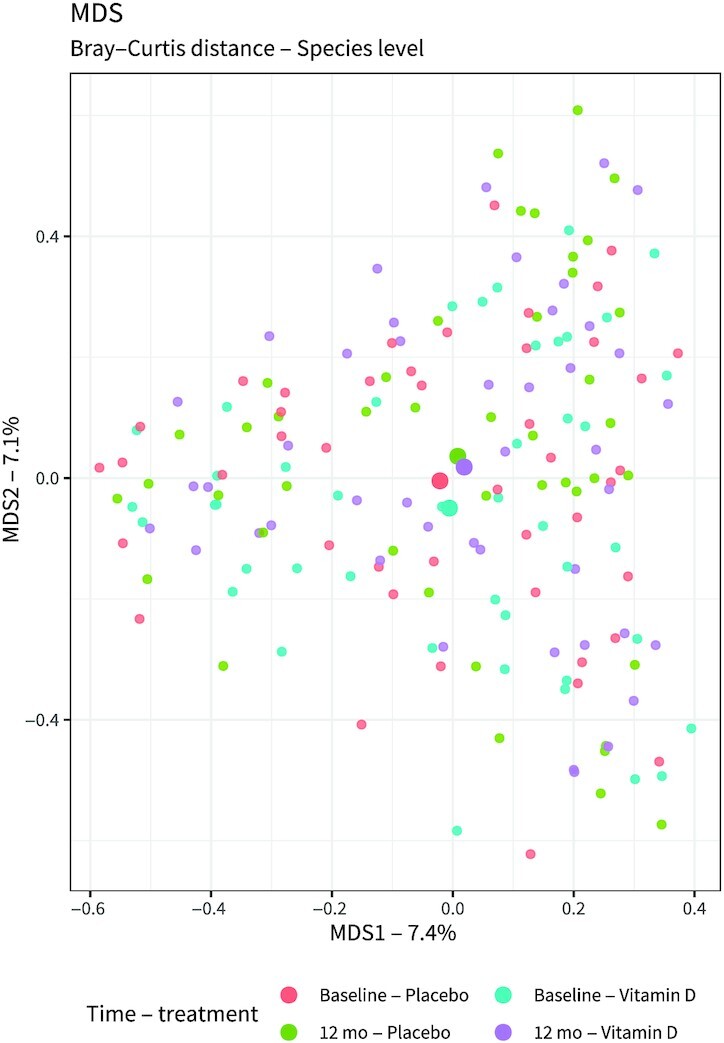
Bray–Curtis distance multidimensional scaling plot showing the nasal microbiota before and after the vitamin D or placebo treatment. Statistical analysis was performed on 88 placebo samples (n = 44, baseline; n = 44, 12-mo) and 88 vitamin D samples (n = 44, baseline; n = 44, 12-mo). No effect of active treatment was observed when taking both sampling points into account (PERMANOVA: R2 = 0.006036, P = 0.837433), nor when only considering the samples collected at the last study visit (PERMANOVA: R2 = 0.0212145, P = 0.538). MDS1: dimension 1, representing 7.4% of total variation; MDS2: dimension 2, representing 7.1% of total variation. PERMANOVA, permutational multivariate ANOVA.