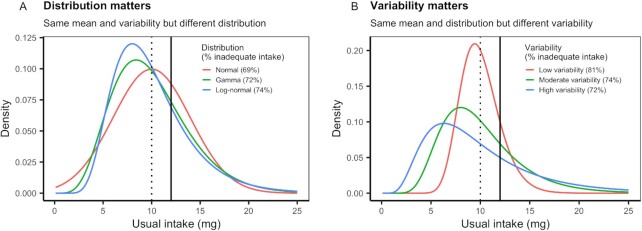
FIGURE 2.
Stylized usual nutrient intake distributions illustrating the importance of intake distribution shape in determining the prevalence of inadequate nutrient intake. (A) All 3 distributions have the same mean (μ = 10 mg; vertical dotted line) and CV (0.4) but are described by different probability distributions. (B) All 3 distributions are log-normal with the same mean (μ = 10 mg; dotted vertical line) but different levels of variability (CV: low = 0.2, moderate = 0.4, high = 0.6). Percentages indicate the percentage of the population estimated to have inadequate nutrient intakes given an Average Requirement (solid vertical line) of 12 mg with a CV of 0.10 and calculated using the probability method (25).

