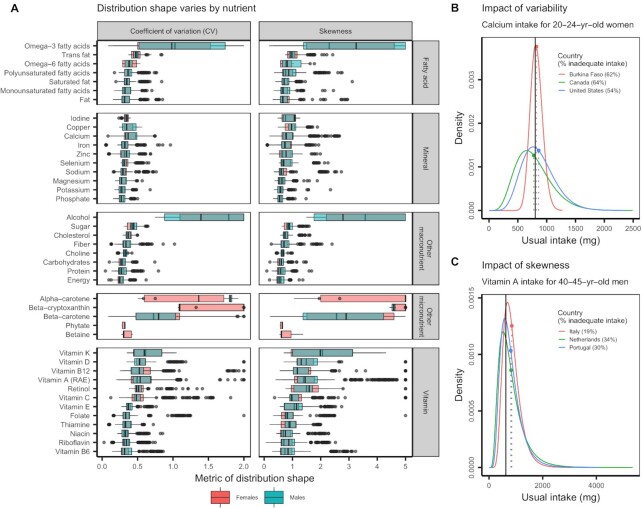
FIGURE 3.
(A) The CV and skewness of usual intake distributions by nutrient. Country–sex–age group representation varies among nutrients, and only nutrients with data from ≥3 countries are shown. In the boxplots, the solid line indicates the median, the box indicates the interquartile range (IQR; 25th and 75th percentiles), the whiskers indicate 1.5 times the IQR, and the points beyond the whiskers indicate outliers. The side panels use selected distributions to illustrate the impact of the (B) variability and (C) skewness of intake distributions on the prevalence of inadequate nutrient intakes. (B) Twenty- to 24-y-old women in the selected countries exhibit usual calcium intakes with similar means but differing levels of variability. (C) Forty- to 45-y-old men in the selected countries exhibit usual vitamin A intakes with similar means but differing levels of skewness. In both panels, the dotted vertical lines indicate the mean usual intakes, the solid vertical lines indicate the Average Requirements, and the percentages indicate the prevalence of inadequate nutrient intakes within each subpopulation using the probability approach (25). RAE, retinol activity equivalents.

