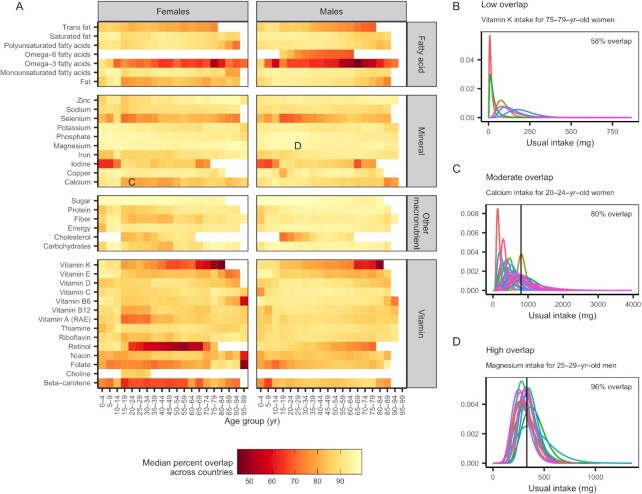
FIGURE 4.
(A) The similarity in usual nutrient intake distributions across countries. Colors indicate the median percent overlap of all pairwise combinations of intake distributions from countries within each sex–age group. Country–sex–age group representation varies among nutrients, and only nutrients with data from ≥3 countries are shown. Lower overlap values indicate larger differences in nutrient distributions among countries, and higher overlap values indicate smaller differences in nutrient distributions among countries. The side panels illustrate examples of (B) low, (C) moderate, and (D) high overlap in usual intake distributions among countries. The colored lines represent usual intake distributions for different countries, solid vertical lines indicate the Average Requirements (if available), and percentages indicate the mean percent overlap. RAE, retinol activity equivalents.

