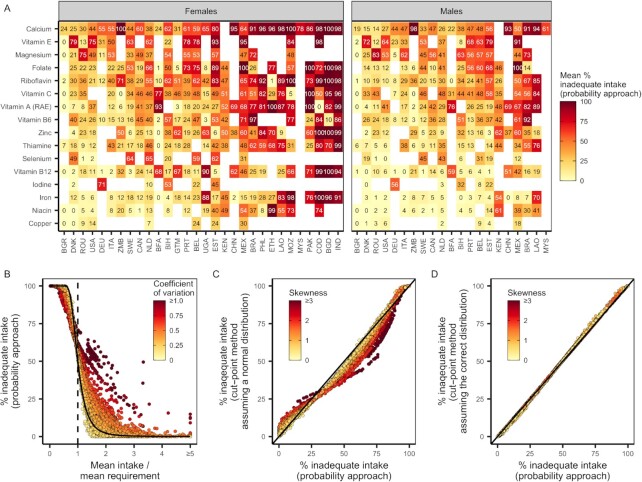
FIGURE 5.
The prevalence of intake inadequacy based on (A) country, nutrient, and sex; (B) the mean and variability of usual nutrient intake distributions; and (C, D) the method for calculating intake inadequacy and its assumptions regarding the symmetry of intake distributions. In (A) and (B), intake inadequacies were calculated using the probability method. In (A), color and numbers indicate the mean percent nutrient intake inadequacy across age groups within a country. Nutrients and countries are ordered by severity of intake inadequacy. In (B) and (C), points represent usual nutrient intake distributions for each nutrient–country–sex–age group. In (B), the dashed vertical line indicates mean intakes equivalent to mean requirements. To further illustrate the impact of usual intake distribution shape on intake inadequacy, the solid curve indicates, for reference, the intake inadequacy for a normally distributed intake distribution with a CV of 0.25. In (C) and (D), points compare the prevalence of inadequate intakes estimated using the probability method and the cut-point method when assuming (C) normally distributed usual intake distributions and (D) the correct usual intake distributions. RAE, retinol activity equivalents.

