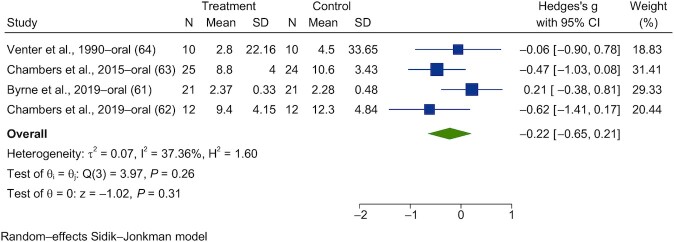
FIGURE 16.
Forest plots for randomized controlled trials of chronic propionate on fasting blood insulin. Chronic interventions with propionate had a main effect of −0.22 (95% CI, −0.65 to 0.21; P = 0.31) on the postintervention intervention fasting blood insulin. (n = 67). A random-effects model was used to calculate standardized mean differences (squares), 95% CIs (horizontal lines), and summary effects (diamond). The study weight (expressed as a percentage) indicates the relative contribution of an individual study to the overall pooled effect size. Between-study heterogeneity was calculated using the I2 statistic. A P value ≤ 0.05 was considered statistically significant. When interpreting effect sizes, values <0.40 were categorized as having a small effect size, values 0.40 to 0.70 as having a moderate effect size, and values >0.70 as having a large effect size.

