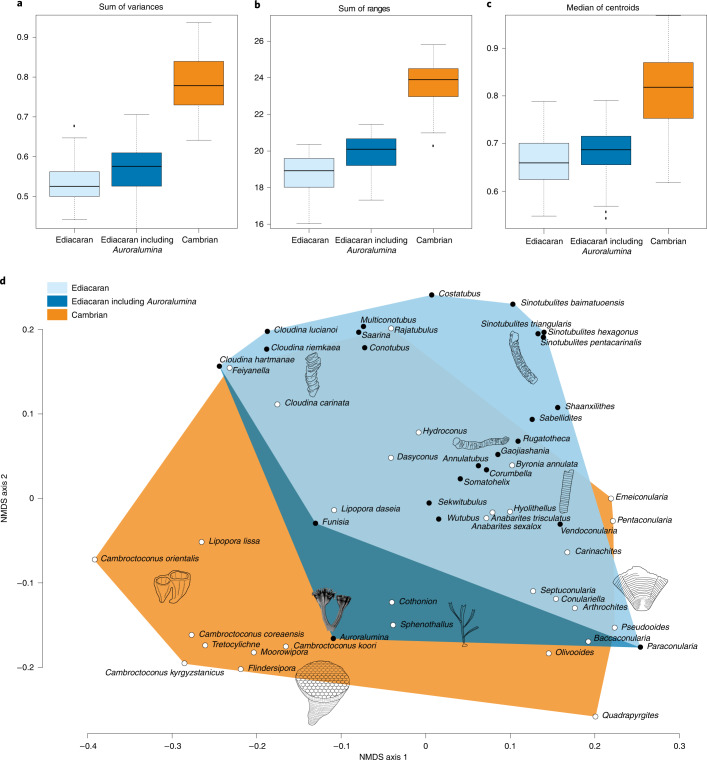
Fig. 5. Tubular morphospace occupation across the Ediacaran–Cambrian transition.
a–c, The sum of variances (a), sum of ranges (b) and the median of centroids (c) for tubular morphospace occupation. The sum of variances examines the evenness of morphospace occupation, the sum of ranges examines the extent of morphospace occupation in all computed dimensions and the median of centroids measures the clustering of taxa around a central point. Adding Auroralumina increases the sum of variances, ranges and (marginally) the median of centroids compared to Ediacaran morphospace excluding Auroralumina. The boxes represent the interquartile range, with black line showing the median. The whiskers indicate minimum (Q1 − 1.5 × IQR) and maximum (Q3 + 1.5 × IQR), excluding outliers. Outliers are shown in black squares. d, Morphospace occupation with convex hulls showing Ediacaran morphospace occupation with and without Auroralumina and Cambrian morphospace occupation. Black circles represent Ediacaran taxa and white circles represent Cambrian taxa.

