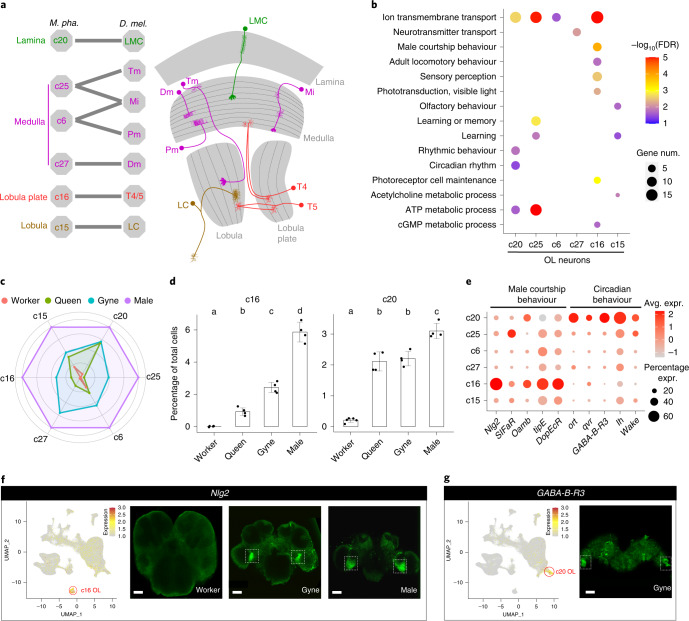
Fig. 4. The conserved OL neurons between Monomorium and Drosophila.
a, Annotation of the Monomorium OL clusters (left) based on transcriptional similarity comparison with two independent Drosophila OL single-cell datasets41,42 (Extended Data Fig. 6) and a schematic diagram of the Drosophila OL (right) highlighting the OL cell types conserved in Monomorium. Tm, transmedullary neuron; Mi, medulla intrinsic neuron; Pm, proximal medulla neuron and LC, lobula columnar cells. b, Representative GO terms enriched (FDR < 0.05) by the up-regulated DEGs in each OL cluster relative to the remaining OL neurons. Dot colours represent FDR values for each GO term, and dot sizes represent the number of DEGs associated with each GO term. c, Radar plot showing the variation in relative abundance of each OL cell type against total brain cells across phenotypes. For each OL cluster, the mean across replicates of a phenotype was determined first and then divided by the maximum among the four phenotypes. d, Percentage of cells from c16 (left) and c20 (right) against the total number of brain cells in each adult phenotype. Each dot presents the biological replicate value of an adult phenotype (n = 5 for workers, 4 for queens, 4 for gynes and 4 for males), bars are means ± s.d. across replicates and lowercase letters assign bars to different groups that were significantly different as assessed by scCODA. e, Expression of representative top DEGs from c16 and c20 across all OL clusters. Dot colours represent average expression level of a gene and dot sizes represent percentages of cells within each cluster expressing that gene. f,g, UMAP plot and whole-mount RNA in situ detection of Nlg2 (f) and GABA-B-R3 (g) in the brains of focal adult phenotypes. The UMAP plots are coloured by gene expression (grey is low and red is high), with red circles indicating the cell clusters that preferentially expressed the focal marker genes. White dotted boxes indicate the positions of hybridization signals in the brain images. Scale bars in f; 40, 50 and 50 μm, respectively and g, 50 μm.

