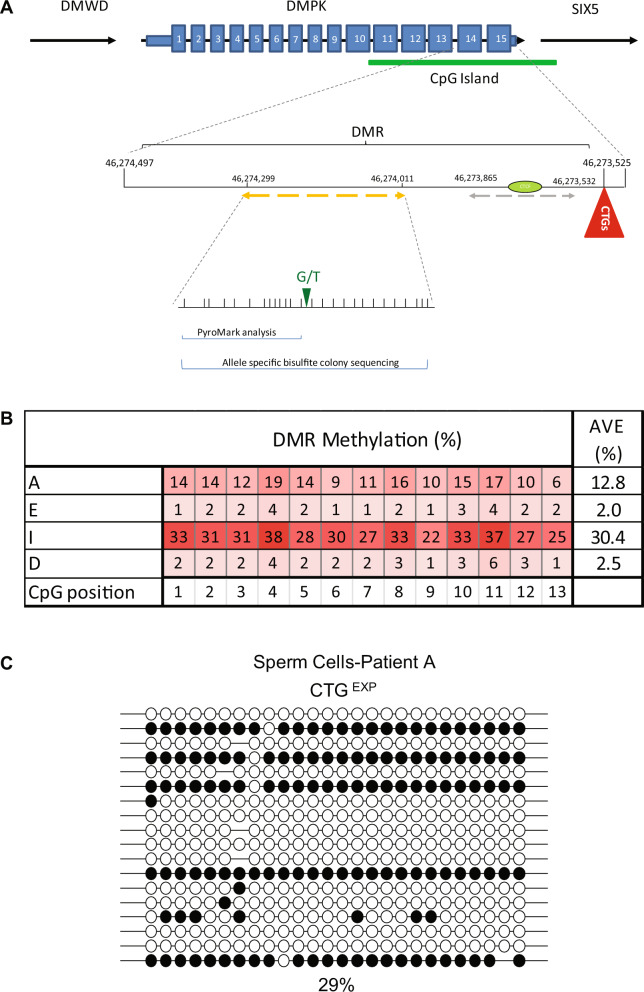
Fig. 1. DM1 sperm cell methylation analysis.
A Graphic illustration of the human DM1 locus, including DMWD, DMPK, and SIX5 genes. Indicated in detail the differentially methylated region (DMR) upstream to the CTG repeats. Dashed line in orange designates the amplicon that was used for the methylation analysis in this study covering SNP rs635299 (G/T), while dashed line in gray designates the amplicon that was used for the methylation analysis in Barbe et al. [14]. CTCF1 binding site is designated by green ellipse. The numbering represents chromosome 19 positioning according to the hg19 human genome assembly. B Absolute methylation levels in region E (488–777 bp upstream of the CTGs), as determined by bisulfite pyrosequencing. The 13 CpG sites tested are indicated by shaded squares according to methylation levels (see colored legend). Mean absolute methylation levels across all tested CpG positions are indicated to the right in each line. C Allele-specific bisulfite sequencing of the expanded allele (CTGEXP) within the differentially methylated region of DMPK (region E in [4]), overlapping SNP2 (according to [4]), in DNA extracted from sperm sample of patient A. Full circles correspond to methylated CpGs, whereas empty circles represent unmethylated CpGs. Methylation levels (%) were determined by the analysis of 20 molecules by bisulfite colony sequencing. Methylation levels (29%) are indicated at the bottom.

