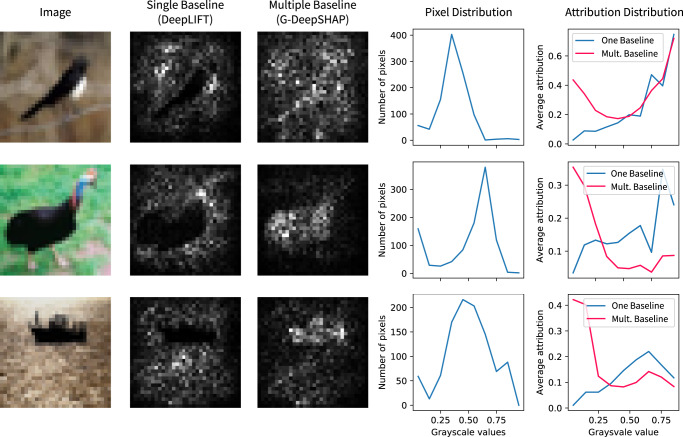
Fig. 2. Using a single all-black baseline image (DeepLIFT) leads to biased attributions compared to attributions with a randomly sampled baseline distribution (G-DeepSHAP).
The image is the explicand. The attribution plots are the sum of the absolute value of the feature attributions for the three channels of the input image. The pixel distribution is the distribution of pixels in terms of their grayscale values. The attribution distribution is the amount of attribution mass upon a group of pixels binned by their grayscale values.

