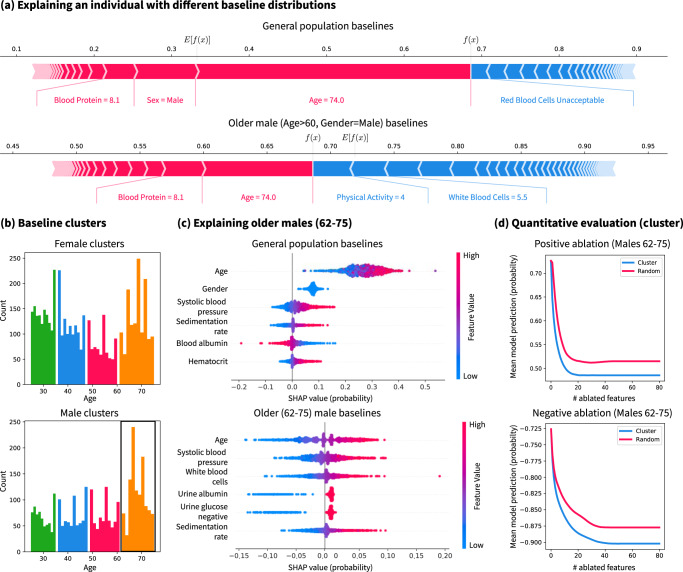
Fig. 3. The baseline distribution is an important parameter for model explanation.
a Explaining an older male explicand with both a general population baseline distribution and an older male baseline distribution. Red colors denote positive attributions and blue denotes negative attributions. b Automatically finding baseline distributions using 8-means clustering on age and gender. Each cluster is shown in a different color. c Explaining the older male subpopulation (62–75 years old) with either a general population baseline or an older male baseline. d Quantitative evaluation of the feature attributions via positive and negative ablation tests where we mask with the mean of the older male subpopulation (the negative ablation test reports negative mean model output so that lower is better). Note that b shows summary plots (Supplementary Methods Section 1.3.3) and c shows dependence plots (Supplementary Methods Section 1.3.2).

