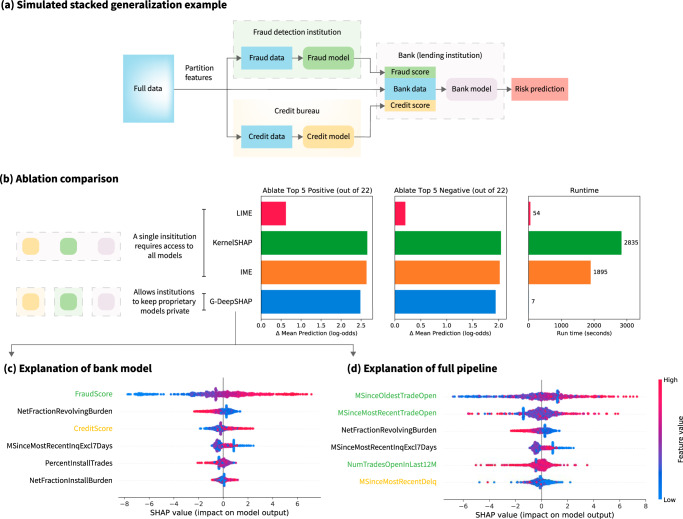
Fig. 7. Explaining a stacked generalization pipeline of models for the HELOC data set (details in Supplementary Methods Section 1.1.7).
a A simulated model pipeline in the financial services industry. We partition the original set of features into fraud, credit, and bank features. We train a model to predict risk using fraud data and a model to predict risk using credit data. Then, we use the outputs of the fraud and credit models as scores alongside additional bank features to predict the final customer risk. b Ablation tests (ablating top five positive/negative features out of a total 22 features) comparing model-agnostic approaches (LIME, KernelSHAP, IME), which require access to all models in the pipeline, and G-DeepSHAP, which allows institutions to keep their proprietary models private. c Summary plot of the top six features the bank model uses to predict risk (TreeSHAP). d Summary plot of the top six features the entire pipeline uses to explain risk (G-DeepSHAP). The green features originate from the fraud data and the yellow features from the credit data. We explain 1000 randomly sampled explicands using 100 randomly sampled baselines for all attribution methods. Note that (c) and (d) show summary plots (Supplementary Methods Section 1.3.3).

