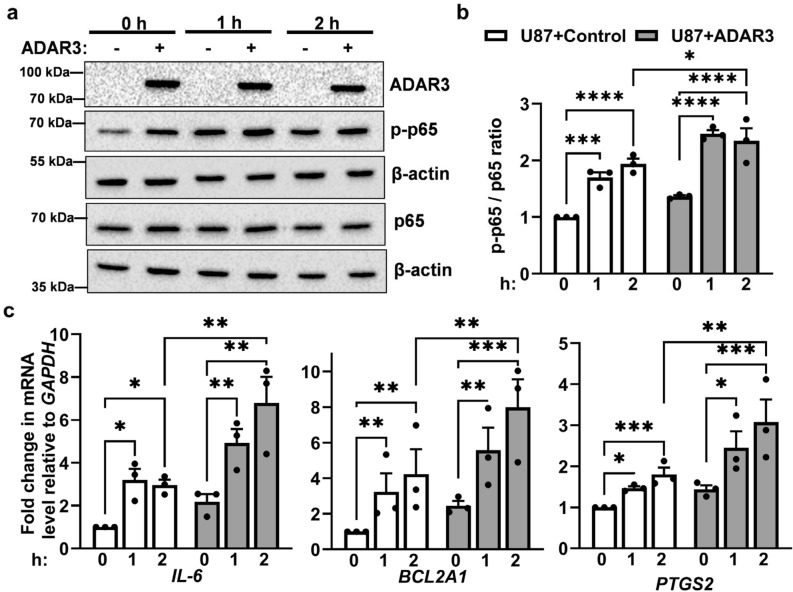
Figure 4.
Increased TNF-α induced NF-κB activation in ADAR3-expressing cells. (a) Control and ADAR3-expressing U87 cells were treated with 10 ng/mL TNF-α for 0, 1, and 2 h. Equivalent amounts of cell lysate were subjected to immunoblotting with the indicated antibodies. Blot is a representative image (replicate 1) of three biological replicates and uncropped images are included in the supplementary information file (b) Quantification of phosphorylated p65 protein (p-p65) to total p65 protein levels was determined relative to β-actin controls for each immunoblot. The relative p-p65/p65 ratios were normalized to the U87 control cells at 0 h. Error bars represent SEM. Statistical significance was determined by two-way ANOVA Fisher’s least significance difference (LSD) test. *p ≤ 0.05, **p ≤ 0.005 ***p ≤ 0.0005, ****p < 0.0001 (c) qRT-PCR was performed to quantify the expression of the indicated genes after 0, 1 and 2 h TNF-α treatment. The expression of each gene relative to GAPDH in all conditions was normalized to the expression of same gene relative to GAPDH in control cells at 0 h. The mean of three biological replicates is plotted with error bars representing SEM. Statistical significance was determined using ordinary two-way ANOVA Fisher’s LSD test. *p ≤ 0.05, **p ≤ 0.005 ***p ≤ 0.0005, ****p < 0.0001, ns indicates no significant difference.

