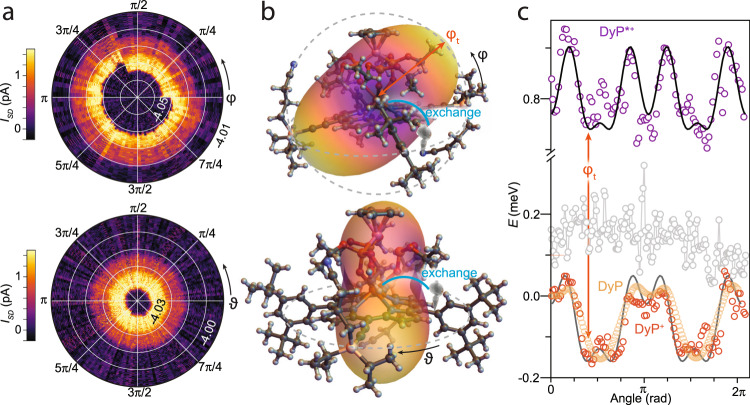
Fig. 6. Angular relation to single-ion anisotropy.
a Measured angular evolution of the exchange effect, showing the current (color scale) vs. VG (radial) and the angle (top: out-of-plane φ; bottom: in-plane θ), under constant magnetic field-magnitude |B | = 1 T, at VSD = 1.5 mV. A charge jump is observed for 0 < φ < 2π/3). b Iso-energy representation of the single-ion anisotropy of the Dy(III) ion, superimposed onto the molecular structure, as viewed from sideways in the single-molecule device architecture (top) and along the electron transport channel (bottom). c Angular evolution of the energy, relative to the ground state at zero angle, of the DyP+* (violet) and DyP+ (orange) states vs. φ, with the anisotropy energy extracted from torque measurements on the DyP at the same temperature superimposed (yellow). The lack of evolution vs. θ is also shown (gray). Black lines are fits to the data (see text). All data were acquired at 20 mK.

