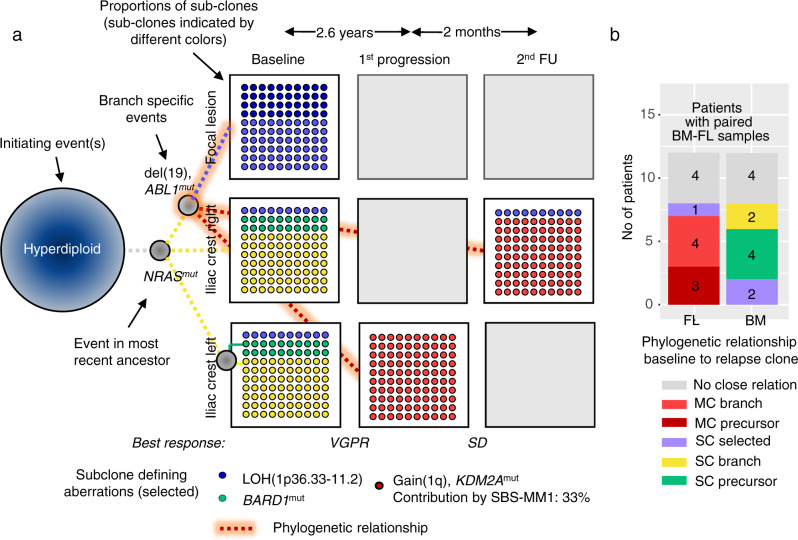
Fig. 3. Phylogenetic relationship between baseline and relapse clones.
We analyzed the phylogenetic relationship between baseline clones from different bone marrow regions and relapse clones to elucidate the origin of resistant disease. To highlight the unknowns in our sample/dataset, we have chosen a format with flipped and unflipped (blank) cards reminiscent of a memory game. In a the mock phylogenetic tree for P6 is shown as an example for a pattern where the unique baseline focal lesion clone and the dominant relapse clone share the phylogenetic branch. The boxes show the proportion of detected subclones, with each subclone having a distinct color. For instance, ten blue dots indicate a proportion of 10% for the “blue” subclone. Dashed lines illustrate the origin/relationship of these subclones and the color code corresponds to the color of the subclones. The gray box/card indicates that tumor data is not available for the respective site at relapse. A timeline of treatment and sampling alongside a detailed mock oncogenetic tree is shown in Suppl. Fig. 8. FU follow-up, VGPR very good partial remission, SD stable disease. b For 12 patients with paired baseline iliac crest/focal lesion samples, the relationship is shown separately for the focal lesion (FL, left bar), and the iliac crest (BM, right bar). No close relationship (gray): baseline and relapse clones represent different evolutionary branches as shown for the dominant iliac crest and the relapse clone in a; selected: a preexisting resistant clone is selected (example in Suppl. Fig. 1); branch: the two clones share the same branch, as shown for the baseline focal lesion and the relapse clone in a; precursor: linear relationship between baseline and relapse clone, i.e., the clone acquires new aberrations; SC subclone is related to relapse clone, MC major/dominant clone is related to relapse clone. Source data are provided as a Source Data file.

