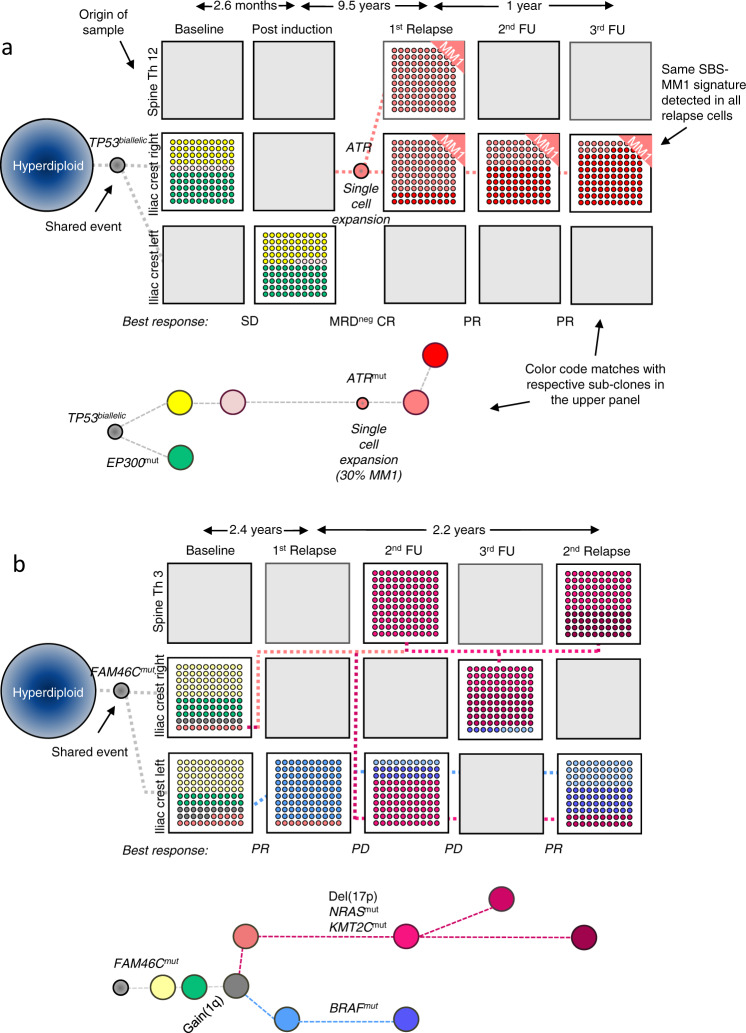
Fig. 4. Evolutionary patterns during treatment.
In a the mock phylogenetic tree for patient #22 is shown as an example of a pattern where relapse is initially driven by a single cell. Subsequently, the first relapse clone is replaced by a further evolved descendant subclone. Expansion of a single cell was demonstrated by a mutational signature analysis which showed a significant contribution of the melphalan signature SBS-MM1 to relapse clone-defining mutations. A timeline of treatment and sampling alongside a detailed mock oncogenetic tree is shown in Suppl. Fig. 24. In b two independent branches drive relapse and longitudinally alternate in dominance in patient #14 which resembles the classical alternating clonal dominance model by ref. 15. Yet, clonal dominance also alternates in space. Due to space constraints data for another left iliac crest sample after the sixth treatment line (second FU in the plot) is not presented but shown in detail in Suppl. Fig. 16. The boxes show the proportion of detected subclones, with each subclone having a distinct color. Dashed lines illustrate the origin/relationship of subclones/branches. For instance, in b all subclones belonging to the “red branch” are interconnected by a red dashed line. Selected clone-defining mutations are shown for each branch, with known myeloma drivers being in bold. The length of branches does not indicate the extent of differences between clones but the time point of their first appearance. Gray boxes/cards indicate that tumor data is not available for the respective time points and sites. FU follow-up, PR partial remission, SD stable disease, PD progressive disease, MRDneg CR minimal-residual-disease negative complete remission. Source data are provided as a Source Data file.

