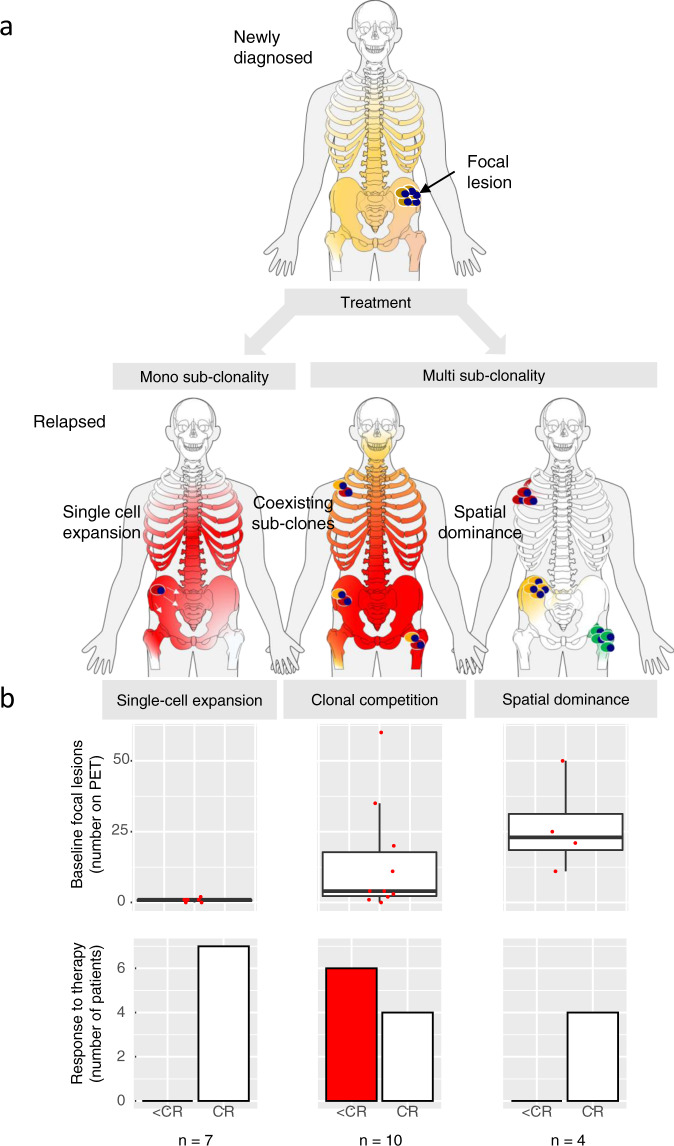
Fig. 6. Evolutionary patterns and association with clinical features.
In a the three evolutionary patterns, which we observed in this study, are illustrated. These include (1) expansion and sweep driven by single tumor cells, (2) coexisting expanding subclones, and (3) site-unique expansions of distinct subclones, with the main difference between the second and the third pattern being the anatomical location of subclones. In b, boxplots are shown for the association between these patterns and (1) the number of PET-positive focal lesions at baseline (upper panel) and (2) the response to first-line therapy (lower panel), respectively. The boxplots show the median and the interquartile range, while the upper and lower whiskers show the highest and lowest values (excluding outliers), respectively. CR complete remission. Source data are provided as a Source Data file.

