Figure 3.

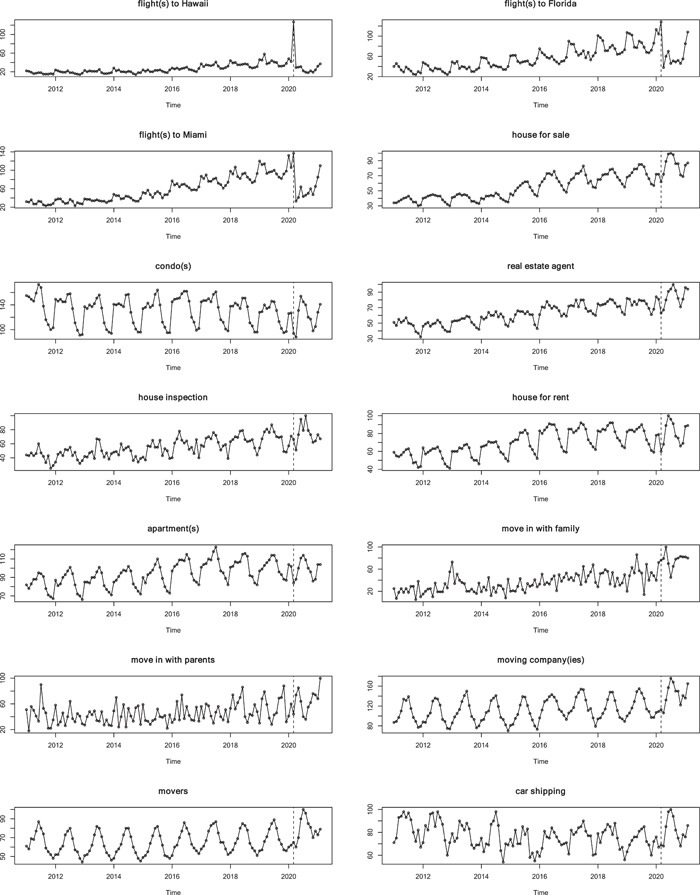
Time series plots of monthly relative interests on selected search terms from January 2011 to February 2021. The vertical dashed lines indicate March 2020.

Time series plots of monthly relative interests on selected search terms from January 2011 to February 2021. The vertical dashed lines indicate March 2020.