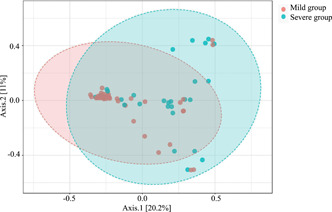
Figure 3.

Beta diversity between mild group and severe group. PCoA of Bray‐Curtis distances indicated differences in the mild group (orange) and severe group (green). Each point represents one sample and each color shows all samples from the same group. R = 0.143, p < 0.003. PCoA, principal coordinate analysis.
