
Figure 5.
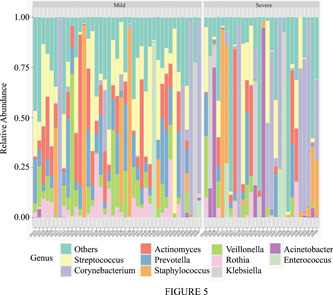
Taxonomy bar plot showing the top 10 microbiome profile at phylum level. This bar plot shows the main species composition of each sample in the two groups at the genus level, respectively.
Official websites use .gov
A
.gov website belongs to an official
government organization in the United States.
Secure .gov websites use HTTPS
A lock (
) or https:// means you've safely
connected to the .gov website. Share sensitive
information only on official, secure websites.
Taxonomy bar plot showing the top 10 microbiome profile at phylum level. This bar plot shows the main species composition of each sample in the two groups at the genus level, respectively.