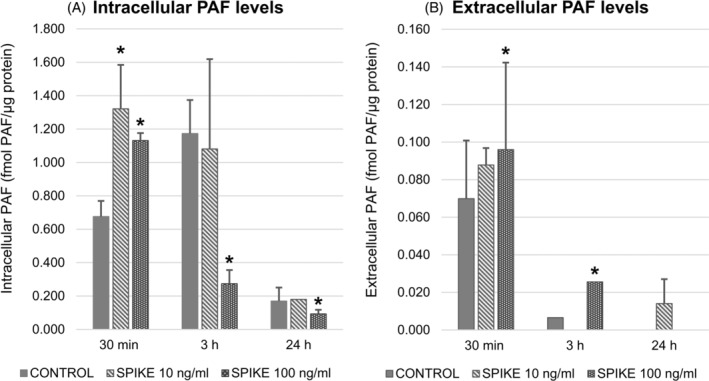
FIGURE 4.

Intracellular and extracellular PAF levels in U‐937 stimulated with the spike protein (10 ng/ml and 100 ng/ml) at 0.5, 3 or 24 h. (A) The spike protein at 10 and 100 ng/ml induced an elevation of intracellular PAF levels at 0.5 h; a significant decrease of intracellular PAF levels at the order of 77% and 50% was observed at 3 and 24 h, respectively with 100 ng/ml spike protein. (B). Extracellular PAF levels were increased at 0.5 and 3 h with 100 ng/ml spike protein. The (*) symbol represents p ≤ 0.05 in comparison with non‐stimulated cells (baseline levels) within time group
