FIGURE 1.

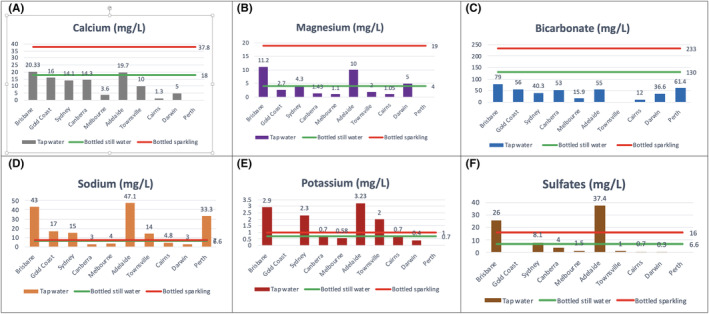
(A–F) Mineral composition of tap water across Australia, compared with average mineral content in bottled still and sparkling water available in Australia (Stoots et al. 33 )

(A–F) Mineral composition of tap water across Australia, compared with average mineral content in bottled still and sparkling water available in Australia (Stoots et al. 33 )