Abstract
Coronavirus disease 2019 (COVID‐19) pandemic spread rapidly with more than 515 million cases and 6.2 million deaths. Epidemiological factors are important for understanding the state of the pandemic. This study aims to evaluate the hospitalizations, intensive care unit (ICU) admissions, and lethality from March 2020 to April 2022. Data were collected from a hospital in Porto Alegre city, southern Brazil. The Mann–Whitney, analysis of variance, and Kruskal–Wallis tests were used to compare quantitative variables. Categorical variables were compared by Pearson's χ 2 test. p values <0.05 for all tests were considered significant. Were observed 3784 hospitalizations. Males were 51.4% and the age was 60.4± 20.3. Intensive care unit (ICU) patients were 31.2%, the median length of stay (LOS) was 9.0 and lethality was 13.3%. ICU lethality was 34.5% versus 4.6% in other inpatients (p < 0.01). The LOS of ICU patients was 22.0 versus 7.0 in other inpatients (p < 0.01). The first peak (July–Novemebr 2020) showed ICU occupancy of 79.1%. The second peak (December 2020–June 2021) with 91.6% occupancy. The third peak January–March 2022 with 81.0% occupancy (p < 0.01). Lethality rates were 10.3% in 2020, 14.9% in 2021 and 15.4% in 2022 (p < 0.01). In conclusion, the ICU occupancy rate was higher in 2021 and the lethality rates of ICU patients were high during pandemic years (10.3% in 2020, 14.9% in 2021, and 15.2% in 2022). The lethality of these patients ranged from 25.0% in March to 21.8% in December 2020, from 20.9% in January 22.2% in Decemebr 2021, and 35.7% in January 2022 to 21.4% in April 2022. These data demonstrate that COVID‐19 is a critical illness, even in a private hospital setting.
Keywords: COVID‐19, intensive care unit, length of stay, lethality
1. INTRODUCTION
Coronavirus disease 2019 (COVID‐19) pandemic spread rapidly and this scenario is concerning worldwide with more than 515 million cases and 6.2 million deaths. 1 Brazil is the Latin American country with the largest number of deaths due to COVID‐19 recording more than 30 million reported cases and 660 000 deaths. 2
The epidemiological characterization of COVID‐19 is essential to understanding the pandemic cases and deaths distributions and the hospital status resulting from the demand generated for health services. The first and second waves of the pandemic were essential for establishing the spread of severe acute respiratory syndrome coronavirus 2 (SARS‐CoV‐2) in Brazil, 3 , 4 which culminated in an overload on health systems, whether public or private. 5 , 6 , 7 , 8 , 9
More recently, the spread of the omicron variant has returned the alert for the progression and evolution of the pandemic, even though mass vaccination and herd immunity were already established, the number of cases and occupations in the intensive care unit (ICU) were worrying between January and March 2022. 10 , 11 , 12 In this sense, it is essential to study the outcomes of hospitalizations, ICU admission, use of mechanical ventilation, readmissions, and lethality to qualify and quantify the impact of COVID‐19 on the hospital system. 5 , 6 , 7 , 8 , 9 , 13 , 14 , 15
Therefore, the present study aims to evaluate the number of hospitalizations, ICU admissions, mortality rates, use of mechanical ventilation, and length of stay (LOS) in COVID‐19 admission between March 2020 and April 2022 in southern Brazil.
2. METHODS
2.1. Data collection
This was a retrospective longitudinal study carried out in Brazil, in the city of Porto Alegre, State of Rio Grande do Sul (RS), at the Hospital Moinhos de Vento (HMV). All participants signed an informed consent form and this study was approved by the Institutional Review Board of the National Health Council of Brazil (approval number 4.497.118). The study analyzed data from hospital records of 3784 patients hospitalized with COVID‐19, confirmed by RT‐PCR, between March 2020 and April 2022. ICU occupancy rates were obtained using the institutional business intelligence software (Qlik sense®) (https://www.qlik.com/pt-br/products/qlik-sense). Qlik sense is updated in real‐time with assisted data from the HMV.
2.2. Overall characteristics of Rio Grande do Sul and hospital Moinhos de Vento
The RS has moderately cold winters with the occurrence of frosts and occasional snow and hot summers. Currently, the population of RS is approximately 11.5 million, with the city of Porto Alegre being the most populous (approximately 1.5 million inhabitants) (https://cidades.ibge.gov.br/brasil/rs). Figure 1 demonstrates the location of RS in South America. The HMV is located in Porto Alegre and has a daily average of approximately 14 000 consultations and a monthly average of 2800 hospitalizations. Currently, it has 500 hospital beds, 70 of which are in adult ICU. It is a hospital with cares for patients with private plans.
Figure 1.
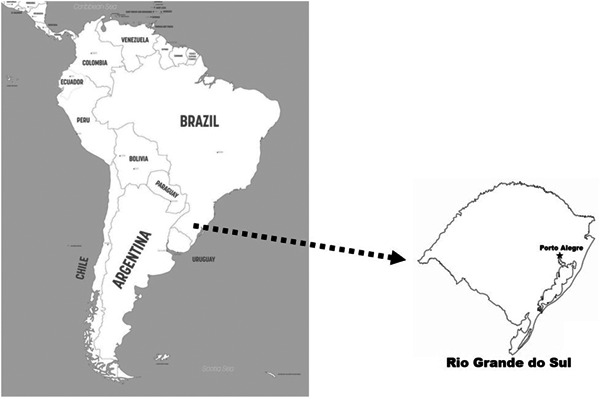
Map of South America, highlighting the Rio Grande do Sul (Porto Alegre city), Brazil.
2.3. Molecular epidemiology data collection
Phylogenetic data of SARS‐CoV‐2 variants from Brazil, including phylodynamics and phylogeography were collected from the GISAID platform (https://www.gisaid.org/phylodynamics/brazil/). These data are updated by Fundação Oswaldo Cruz with 3.988 SARS‐CoV‐2 genomes collected between March 2020 and May 2022. The method used is the Bayesian, with Monte Carlo Markov Chains.
2.4. Statistical analysis
Kolmogorov–Smirnov with Lilliefors correction and Shapiro‐Wilk tests were performed to evaluate the normality of the continuous data. Age was presented as mean and standard deviation (SD), while the length of stay (LOS) in days was presented as median followed by the interquartile range (IQRs). The Mann–Whitney test was used to compare possible differences between LOS and patients who were admitted to the ICU and other inpatient units. Differences between age and years of the pandemic were tested with analysis of variance and between LOS and years of the pandemic with Kruskal–Wallis tests. Categorical variables are reported as numbers (percentage), and a χ 2 test was used for study comparisons. Pearson's coefficient was used to assess the correlation between the number of hospitalizations and deaths. p values <0.05 for all tests were considered significant. SPSS, Version 23.0 for Windows (SPSS Inc.), and R software (R Foundation for Statistical Computing; <http://www.R-project.org >) were used for data analysis.
3. RESULTS
3.1. Characteristics of hospitalized COVID‐19 patients
The present study evaluated 3784 hospitalized COVID‐19 patients in a private hospital in southern Brazil during the period of the pandemic (March 2020 and April 2022). Table 1 presents the variables gender, mean age, ICU admission, median LOS in days, and outcome. Males were slightly more frequent (51.4%) and the mean age was 60.4 ± 20.3. The age groups were 2.5% for 0–19 years old, 13.1% for 20–39 years old, 30.1% for 40–59 years old, and 54.2% for ≥60 years old. Patients admitted to the ICU were 31.2%, the overall LOS had a median of 9.0 (IQR: 5.0–16.0) and the lethality rate was 13.3% (n = 505/3784). Lethality rate in the ICU was 34.5% (n = 407/1180), while in other inpatient units it was 4.6% (n = 98/2099) (p < 0.01). The LOS of patients admitted to the ICU was 22.0 days (IQR: 12.0–40.0) and was significantly higher than that of patients admitted to other inpatient units 7.0 days (IQR: 4.0–10.0) (p < 0.01).
Table 1.
Demographic and clinical characteristics of patients hospitalized for COVID‐19 during the pandemic
| Variables | n | % |
|---|---|---|
| Sex | ||
| Female | 1838 | 48.6 |
| Male | 1946 | 51.4 |
| Age, mean (SD) | 60.4 (20.3) | |
| Age in years (groups) | ||
| 0–19 | 95 | 2.5 |
| 20–39 | 497 | 13.1 |
| 40–59 | 1140 | 30.1 |
| ≥60 | 2052 | 54.2 |
| ICU admission | ||
| Yes | 1180 | 31.2 |
| No | 2099 | 68.8 |
| Length of stay in days, median (IQR) | 9.0 (5.0–16.0) | |
| Outcome | ||
| Death | 505 | 13.3 |
| Survived | 3279 | 86.7 |
Abbreviations: ICU, intensive care unit; IQR, interquartile range; SD, standard deviation.
3.2. Distribution of hospitalizations and deaths for COVID
Figure 2 shows the distributions of cases and deaths of the COVID‐19 pandemic. The first peak occurred between July and November 2020, causing an average ICU occupancy rate of 79.1% ± 5.6%. The second peak, presented a critical period of cases between December 2020 and June 2021, with an emphasis on March 2021. This peak was critical for the hospital's health system, reaching an average of 91.6% ± 3.1% of ICU occupancy rate. Finally, the third peak presented the concentration of cases and deaths in the first quarter of 2022. The third peak had an average ICU occupancy rate of 81.0% ± 4.3%. The occupancy rate of the second peak was statistically higher when compared to the first and second (p < 0.01).
Figure 2.
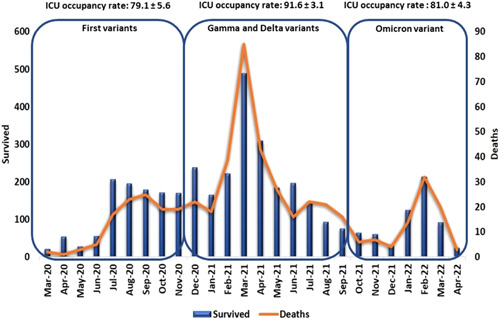
Distribution of COVID‐19 inpatient cases and deaths between March 2020 and April 2022. The columns represent the number of patients who survived (primary axis) and the row is the total deaths for each month (secondary axis). COVID‐19, coronavirus disease‐2019; ICU, intensive care unit
The COVID‐19 lethality rates for total inpatients (not admitted to the ICU + ICU), not admitted to the ICU, and admitted to the ICU are shown in Figure 3. In 2020, lethality rates for total inpatients (not admitted to the ICU + ICU) ranged from 8.7% in March to 8.4% in December. In 2021, rates ranged from 9.8% in January to 11.4% in December, and in 2022 rates ranged from 10.1% in January to 11.1% in April (Table 3). In 2020, lethality rates for patients admitted to the ICU ranged from 25.0% in March to 21.8% in December. In 2021 rates ranged from 20.9% in January to 22.2% in December and in 2022 rates ranged from 35.7% in January to 21.4% in April (Table 4). In 2020, lethality rates for patients not admitted to the ICU ranged from 0.0% in March to 1.7% in December. In 2021 rates ranged from 3.4% in January to 0.0% in December. Finally, in 2022 rates ranged from 3.6% in January to 0.0% in April (Table 5).
Figure 3.
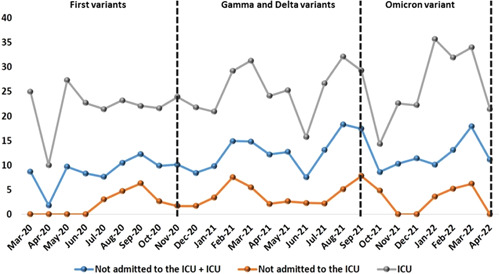
Lethality rates (%) for COVID‐19 for total inpatients (not admitted to the ICU + ICU), not admitted to the ICU, and admitted to the ICU. COVID‐19, coronavirus disease‐2019; ICU, intensive care unit
Table 5.
Lethality rates in the months of the COVID‐19 pandemic of patients not admitted to the ICU
| Months | Other units | Survived | Deaths | Lethality rate % |
|---|---|---|---|---|
| Mar‐20 | 15 | 15 | 0 | 0.0 |
| Apr‐20 | 45 | 45 | 0 | 0.0 |
| May‐20 | 20 | 20 | 0 | 0.0 |
| Jun‐20 | 38 | 38 | 0 | 0.0 |
| Jul‐20 | 168 | 163 | 5 | 3.0 |
| Aug‐20 | 150 | 143 | 7 | 4.7 |
| Sep‐20 | 127 | 119 | 8 | 6.3 |
| Oct‐20 | 117 | 114 | 3 | 2.6 |
| Nov‐20 | 118 | 116 | 2 | 1.7 |
| Dec‐20 | 174 | 171 | 3 | 1.7 |
| Jan‐21 | 116 | 112 | 4 | 3.4 |
| Feb‐21 | 173 | 160 | 13 | 7.5 |
| Mar‐21 | 366 | 346 | 20 | 5.5 |
| Apr‐21 | 191 | 187 | 4 | 2.1 |
| May‐21 | 117 | 114 | 3 | 2.6 |
| Jun‐21 | 130 | 127 | 3 | 2.3 |
| Jul‐21 | 93 | 91 | 2 | 2.2 |
| Aug‐21 | 59 | 56 | 3 | 5.1 |
| Sep‐21 | 51 | 47 | 4 | 7.8 |
| Oct‐21 | 42 | 40 | 2 | 4.8 |
| Nov‐21 | 37 | 37 | 0 | 0.0 |
| Dec‐21 | 17 | 17 | 0 | 0.0 |
| Jan‐22 | 111 | 107 | 4 | 3.6 |
| Feb‐22 | 173 | 164 | 9 | 5.2 |
| Mar‐22 | 65 | 61 | 4 | 6.2 |
| Apr‐22 | 12 | 13 | 0 | 0.0 |
Abbreviations: COVID‐19, coronavirus disease‐2019; ICU, intensive care unit.
Table 2.
Comparison between clinical outcomes and ages of patients hospitalized for COVID‐19 during the pandemic
| Variables | 2020 (n = 1321) | 2021 (n = 2041) | 2022 (n = 422) | p values | |||
|---|---|---|---|---|---|---|---|
| n | % | n | % | n | % | ||
| ICU | <0.01 | ||||||
| Yes | 377 | 28.6 | 707 | 34.6 | 96 | 22.7 | |
| No | 943 | 71.4 | 1334 | 65.4 | 326 | 77.3 | |
| Mechanical ventilation | 0.49 | ||||||
| Yes | 240 | 18.2 | 369 | 18.1 | 88 | 20.8 | |
| No | 1081 | 81.8 | 1672 | 81.9 | 334 | 79.2 | |
| Outcome | <0.01 | ||||||
| Death | 136 | 10.3 | 304 | 14.9 | 65 | 15.4 | |
| Survived | 1185 | 89.7 | 1737 | 85.1 | 357 | 84.6 | |
| Age in years, mean (SD) | 62.0 (18.6) | 59.7 (19.2) | 58.1 (28.2) | <0.01 | |||
| Age in years (groups) | <0.01 | ||||||
| 0–19 | 12 | 0.9 | 37 | 1.8 | 46 | 10.8 | |
| 20–39 | 145 | 11.0 | 272 | 13.3 | 80 | 19.0 | |
| 40–59 | 403 | 30.5 | 681 | 33.4 | 56 | 13.3 | |
| ≥60 | 761 | 57.7 | 1051 | 51.5 | 240 | 56.9 | |
| Lenght of stay in days, median (IQR) | 8.0 (5.0–14.0) | 9.0 (6.0–19.0) | 7.0 (3.0–14.0) | <0.01 | |||
Note: In bold, significant p values are highlighted.
Abbreviations: COVID‐19, coronavirus disease‐2019; ICU, intensive care unit; IQR, interquartile range; SD, standard deviation.
In bold, significant p values are highlighted.
Table 3.
Lethality rates in the months of the COVID‐19 pandemic
| Months | Inpatients | Survived | Deaths | Lethality rate % |
|---|---|---|---|---|
| Mar‐20 | 23 | 21 | 2 | 8.7 |
| Apr‐20 | 55 | 54 | 1 | 1.8 |
| May‐20 | 31 | 28 | 3 | 9.7 |
| Jun‐20 | 60 | 55 | 5 | 8.3 |
| Jul‐20 | 224 | 207 | 17 | 7.6 |
| Aug‐20 | 219 | 196 | 23 | 10.5 |
| Sep‐20 | 204 | 179 | 25 | 12.3 |
| Oct‐20 | 191 | 172 | 19 | 9.9 |
| Nov‐20 | 189 | 170 | 19 | 10.1 |
| Dec‐20 | 261 | 239 | 22 | 8.4 |
| Jan‐21 | 183 | 165 | 18 | 9.8 |
| Feb‐21 | 262 | 223 | 39 | 14.9 |
| Mar‐21 | 574 | 489 | 85 | 14.8 |
| Apr‐21 | 353 | 310 | 43 | 12.2 |
| May‐21 | 212 | 185 | 27 | 12.7 |
| Jun‐21 | 213 | 197 | 16 | 7.5 |
| Jul‐21 | 168 | 146 | 22 | 13.1 |
| Aug‐21 | 115 | 94 | 21 | 18.3 |
| Sep‐21 | 92 | 76 | 16 | 17.4 |
| Oct‐21 | 70 | 64 | 6 | 8.6 |
| Nov‐21 | 68 | 61 | 7 | 10.3 |
| Dec‐21 | 35 | 31 | 4 | 11.4 |
| Jan‐22 | 139 | 125 | 14 | 10.1 |
| Feb‐22 | 245 | 213 | 32 | 13.1 |
| Mar‐22 | 112 | 92 | 20 | 17.9 |
| Apr‐22 | 27 | 24 | 3 | 11.1 |
Abbreviation: COVID‐19, coronavirus disease‐2019.
3.3. Comparison of clinical characteristics of hospitalized COVID‐19 patients
Table 2 shows the comparisons between the variables of ICU admission, use of mechanical ventilation, outcome of lethality, mean age and median LOS. Patients admitted to the ICU were 28.6% (n = 377/1321) in 2020, 34.6% in 2021 (n = 707/2041) and 22.7% (n = 96/422) and it was significantly more frequent in 2021 (p < 0.01). The use of mechanical ventilation was 18.2% (n = 240/1321) in 2020, 18.1% (n = 369/2041) in 2021 and 20.8% (n = 88/422) in 2022 (p = 0.49). Lethality rates were 10.3% (n = 136/1321) in 2020, 14.9% (n = 304/2041) in 2021 and 15.4% in (n = 65/422) in 2022, with the rates significantly higher in 2021 and 2022 compared to 2020 (p < 0.01). However, there was no significant difference between the lethality rates between the years 2021 and 2022 (p = 0.79). The mean ages were 62.0 ± 18.6 in 2020, 59.7 ± 19.2 in 2021 and 58.1 ± 28.2 in 2022 (p < 0.01). The age groups were 0.9% for 0–19 years old, 11.0% for 20–39 years old, 30.5% for 40–59 years old and 57.7% for ≥60 years old in 2020; 1.8% for 0–19 years old, 13.3% for 20–39 years old, 33.4% for 40–59 years old and 51.5% for ≥60 years old in 2021; and 10.8% for 0–19 years old, 19.0% for 20–39 years old, 13.3% for 40–59 years old and 56.9% for ≥60 years old in 2022. Patients admitted in 2020 were significantly older than those admitted in 2021 and 2022 (p < 0.01). The median of the LOS was 8.0 days (IQR: 5.0–14.0) in 2020, 9.0 days (IQR: 6.0–19.0) in 2021 and 7.0 days (3.0–14.0) in 2022 (p < 0.01).
Table 4.
Lethality rates in the months of the COVID‐19 pandemic of patients admitted to ICU
| Months | ICU patients | Survived | Deaths | Lethality rate % |
|---|---|---|---|---|
| Mar‐20 | 8 | 6 | 2 | 25.0 |
| Apr‐20 | 10 | 9 | 1 | 10.0 |
| May‐20 | 11 | 8 | 3 | 27.3 |
| Jun‐20 | 22 | 17 | 5 | 22.7 |
| Jul‐20 | 56 | 44 | 12 | 21.4 |
| Aug‐20 | 69 | 53 | 16 | 23.2 |
| Sep‐20 | 77 | 60 | 17 | 22.1 |
| Oct‐20 | 74 | 58 | 16 | 21.6 |
| Nov‐20 | 71 | 54 | 17 | 23.9 |
| Dec‐20 | 87 | 68 | 19 | 21.8 |
| Jan‐21 | 67 | 53 | 14 | 20.9 |
| Feb‐21 | 89 | 63 | 26 | 29.2 |
| Mar‐21 | 208 | 143 | 65 | 31.3 |
| Apr‐21 | 162 | 123 | 39 | 24.1 |
| May‐21 | 95 | 71 | 24 | 25.3 |
| Jun‐21 | 83 | 70 | 13 | 15.7 |
| Jul‐21 | 75 | 55 | 20 | 26.7 |
| Aug‐21 | 56 | 38 | 18 | 32.1 |
| Sep‐21 | 41 | 29 | 12 | 29.3 |
| Oct‐21 | 28 | 24 | 4 | 14.3 |
| Nov‐21 | 31 | 24 | 7 | 22.6 |
| Dec‐21 | 18 | 14 | 4 | 22.2 |
| Jan‐22 | 28 | 18 | 10 | 35.7 |
| Feb‐22 | 72 | 49 | 23 | 31.9 |
| Mar‐22 | 47 | 31 | 16 | 34.0 |
| Apr‐22 | 15 | 11 | 3 | 21.4 |
Abbreviations: COVID‐19, coronavirus disease‐2019; ICU, intensive care unit.
3.4. Correlation between the number of hospitalized patients and deaths from COVID‐19
There was a significant correlation between the number of patients hospitalized monthly and deaths (R 2 = 0.90; p < 0.01) (Figure 4A). This data behavior was similar when the cases admitted to the ICU were specifically evaluated (R 2 = 0.93; p < 0.01) (Figure 4B). Patients not admitted to the ICU also showed a positive correlation between the number of monthly cases and deaths (R 2 = 0.75; p < 0.01) (Figure 4C).
Figure 4 (A).
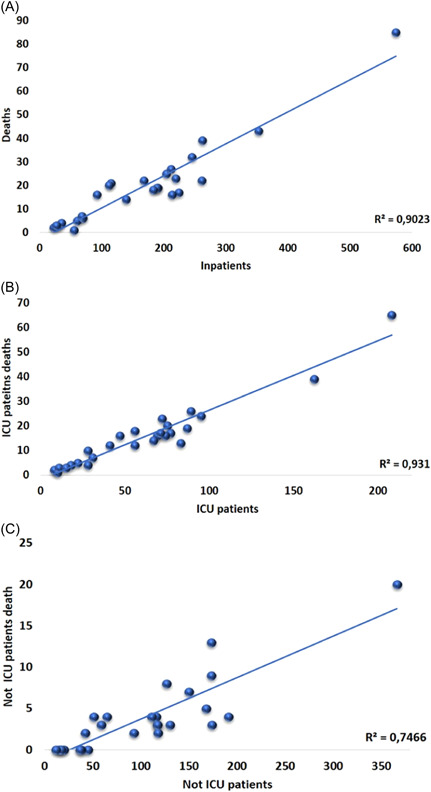
Correlation between cases of hospitalization and deaths. (B) Correlation between patients admitted to the ICU and deaths. (C) Correlation between patients not admitted to the ICU and deaths. ICU, intensive care unit
4. DISCUSSION
In the present study, we identified an ICU admission rate of 31.2% the overall LOS had a median of 9.0 days, and the lethality rate was 13.3%. The lethality rate in the ICU was 34.5%, while in other inpatient units it was 4.6%. The LOS of patients admitted to the ICU was 22.0 versus 7.0 days in other inpatient units. A high number of patients required intensive care at the same time leading to an elevated risk of collapsing the healthcare systems. Until effective and specific treatments are available, supportive measures are a primary factor for critically ill patients. Providing such care at a high‐quality level for the large number of patients to be treated is a major challenge for all healthcare systems in the world.
Interestingly we note that patients who were admitted to the ICU had higher LOS. Despite administrative prioritization to reduce LOS and ICU admission, studies about COVID‐19 have suggested these two outcomes may be related. 13 , 15 , 16 , 17 Reducing LOS during the COVID‐19 pandemic has also been emphasized to preserve resources and limit exposure. Further, we observed returning patients were more likely to have required ICU stay during the LOS. ICU stay serves as a marker of illness severity and thereby may caution medical staff to ensure clinical stability before discharge. 18 Whether continued in‐hospital observation translates into longer LOS for improvement in respiratory profile impacts readmission context and exposure risk warrants further investigation. 19 , 20 , 21
Brazil ranks as third in terms of the total number of reported COVID‐19 cases globally notified. The COVID‐19 epidemic in Brazil was characterized by the co‐circulation of different variants as a consequence of multiple independent introduction events occurring through time. The rapid spread of Gamma and Omicron was also mirrored by a large increase in the number of hospitalizations and deaths. 11
The first peak caused by the initial variants (e.g., Alpha, Beta, and other) between July and November 2020 resulted in the ICU occupancy rate of 79.1%. The second peak, leveraged by the Gamma variant and later by the Delta, presented a critical period of cases between December 2020 and June 2021, mainly in March 2021 (ICU occupancy rate of 91.6%). Finally, the third peak caused by the Omicron presented the concentration of cases and deaths between January and March 2022 (ICU occupancy rate of 81.0%). In 2020, lethality rates for total inpatients ranged from 1.8% in April to 12.3% in September. In 2021, rates ranged from 7.5% in June to 17.4% in September, and in 2022 rates ranged from 10.1% in January to 17.9% in March. In 2020, lethality rates for ICU patients ranged from 10.0% in April to 27.3% in May. In 2021 rates ranged from 14.3% in October to 32.1% in August and in 2022 rates ranged from 21.4% in April to 35.7% in January. In 2020, lethality rates for patients not admitted to the ICU ranged from 0.0% in March, April, May, and June to 6.3 in September. In 2021 rates ranged from 0.0% in November and December to 7.8% in September. Finally, in 2022 rates ranged from 0.0% in April to 6.2% in March.
The rapid spread of multiple variants was also mirrored by a large increase in the number of cases and deaths. This in turn reinforces that, due to the emergence of variants that appear to induce a substantial evasion against neutralizing antibody response, it is important to strengthen genomic effort within the country and how vaccination remains a critical process to protect the vulnerable population, still at risk of infection and death. 11
Festive events in Brazil such as Christmas (mainly) and New Year 2020 and 2021 contribute to the increase in the mobility of people and we hypothesize that this has increased the transmissibility of SARS‐CoV‐2 (Figure 5) with a possible impact on the distributions of cases and deaths by COVID‐19. This can be seen in our study, where the highest number of cases and deaths in COVID‐19 hospitalizations occurred in periods underlying these events. Vaccination in Brazil started on January 17, 2021, which resulted in a substantial drop in the number of cases and deaths after May 2021. However, in early 2022, the appearance of the omicron variant was responsible for the increase in the number of hospitalizations and deaths, but more lightly when compared with the peak of 2021 (mainly March 2021). Additionally, the dynamic of pandemic distributions of cases and deaths are evidenced by the hospitalizations, ICU admissions, and deaths detected during the years 2020, 2021, and 2022, which are supported by the molecular evolution of SARS‐CoV‐2 variants in Brazil (Figure 6A,B).
Figure 5.
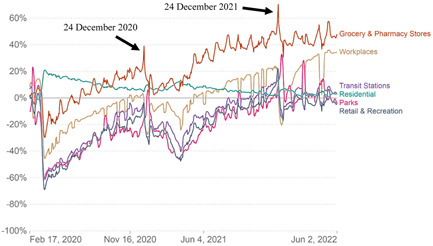
Movement rate of the Brazilian population during the pandemic period. Available: https://ourworldindata.org/covid-google-mobility-trends Accessed June 06, 2022.
Figure 6.
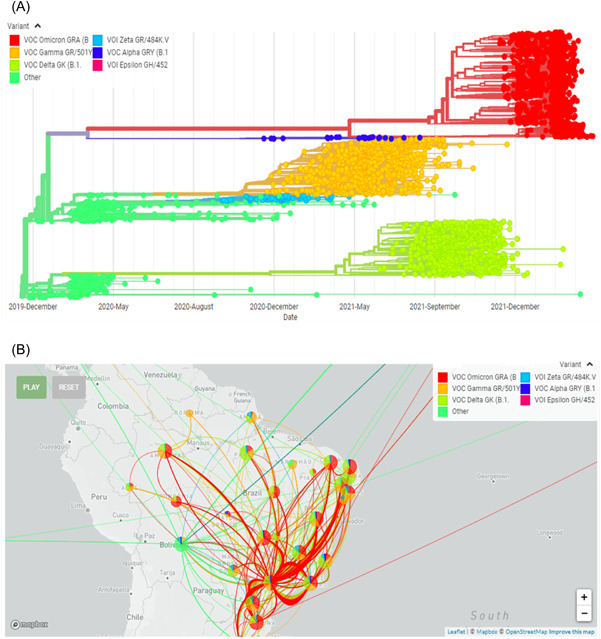
(A) Molecular evolution of SARS‐COV‐2 variants in Brazil. (B) Phylogeography of SARS‐CoV‐2 variants in Brazil. Data extracted from GISAID (Global Initiative on Sharing All Influenza Data). Available: https://www.gisaid.org/phylodynamics/brazil/ Accessed June 06, 2022. SARS‐CoV‐2, severe acute respiratory syndrome coronavirus 2
In the present study, the overall lethality was 13.3%, and specifically for patients admitted to the ICU, it was approximately 35%, which is in agreement with a previous study conducted with a population sample in southern Brazil. In that same study, the use of mechanical ventilation was similar to that observed here (approximately 20%). 9 These findings were similar to those observed in a study conducted in the USA 7 and Europe. 8 In addition, the present study demonstrates that the number of cases was associated with the number of deaths per month and this result is reinforced in a study previously carried out in Europe. 8
To our knowledge, no studies have detailed COVID‐19 lethality rates per month in Brazil since the beginning of the COVID‐19 pandemic. In a comparison with general data on the distribution of cases and deaths in Brazil, the results of the present study agree with the three peaks of the pandemic (first between July and November 2020; second between December and June 2021; third between January and March 2022). In a specific analysis of patients aged ≥60 years who were admitted to the ICU, lethality rates of 41.1% in 2020, 47.7% in 2021, and 56.6% in 2022 were observed in the present study. These data were lower than those reported in Manaus in 2020 (72.9%) and in January 2021 (62.1%), however, they were similar to those reported in São Paulo, Porto Alegre, and Curitiba (approximately 40%). 22 For 2022, we did not have specific data for comparison, but the lethality identified in the present study was high, which may be influenced by the fact that the profile of the patients who were admitted to the ICU (elderly and with comorbidities) and also because we have a lower denominator compared to the previous years.
The ICU occupancy rate profile found in the present study was similar to that shown in the Midwest (Mato Grosso and Mato Grosso do Sul), South (Paraná), Southeast (Minas Gerais), and Northeast (Paraiba and Piaui) regions. However, higher occupancy rates in 2020 were shown in states in the North (Maranhão and Pará) and Northeast (Pernambuco) regions. The profile of the distribution of cases and deaths was similar to states in the South (Santa Catarina), Southeast (São Paulo), and North (Rondônia and Tocantins) regions. In contrast, higher peaks of deaths compared with the present study in 2020 were detected in the states of the Southeast (Rio de Janeiro), North (Rio Grande do Norte and Roraima), and Northeast (Sergipe) regions. 23
It is noteworthy that in 2022 we had an abrupt reduction in hospitalizations, compared with the years 2020 and 2021, mainly 2021. In addition, the fact that our sample was smaller in 2022 (data until the end of April), lethality rates may be biased and overestimated. The collection of demographic and clinical data is not accessible to us at present, but in an analysis of data from 2022, we identified that all patients who died had at least one comorbidity and were generally aged >60 years (92.3%). We understand that we have limitations for the collection of these variables for all cases, unfortunately, this makes it impossible to detail the influence of covariates in the data presented, however, we reinforce the descriptive findings of this manuscript, which may be useful for understanding the panorama of the COVID‐19 pandemic. Additionally, the present study population only included patients within the Rio Grande do Sul state. Second, the data were collected from the electronic health record database. This precluded the level of detail possible with a manual medical record review.
In conclusion, the epidemiology of COVID‐19 hospitalizations and deaths showed important fluctuations, and the present study characterized this process, indicating that the ICU occupancy rate was higher in 2021 (91.6%) and ICU lethality was high during pandemic years (10.3% in 2020, 14.9% in 2021, and 15.2% in 2022). The lethality and the LOS of patients admitted to the ICU were significantly higher than that of patients admitted to other inpatient units. The lethality of ICU patients ranged from 25.0% in March to 21.8% in December 2020, from 20.9% in January to 22.2% in December 2021, and 35.7% in January 2022 to 21.4% in April 2022. These data demonstrate that COVID‐19 is a critical illness, even in a private hospital setting.
AUTHOR CONTRIBUTIONS
Jonas M. Wolf, Helena Petek, Juçara G. Maccari, and Luiz A. Nasi designed the study. Jonas M. Wolf performed the statistical analyses. Jonas M. Wolf, Helena Petek, Juçara G. Maccari, and Luiz A. Nasi wrote the first draft of the manuscript and contributed to the literature review and discussion of the results. All authors contributed to and have approved the final manuscript.
CONFLICTS OF INTEREST
The authors declare no conflicts of interest.
ETHICS STATEMENT
All participants signed an informed consent form and this study was approved by the Institutional Review Board of the National Health Council of Brazil (approval number 4.497.118).
ACKNOWLEDGMENT
This study did not receive any specific grant from funding agencies in the public, commercial, or not‐for‐profit sectors.
Wolf JM, Petek H, Maccari JG, Nasi LA. COVID‐19 pandemic in southern Brazil: Hospitalizations, intensive care unit admissions, lethality rates, and length of stay between March 2020 and April 2022. J Med Virol. 2022;94:4839‐4849. 10.1002/jmv.27942
DATA AVAILABILITY STATEMENT
The data that support the findings of this study are available from the corresponding author upon reasonable request.
REFERENCES
- 1. John Hopkins University of Medicine . Coronavirus Resource Center. Accessed June 06, 2022. https://coronavirus.jhu.edu/map.html
- 2. Ministry of Health of Brazil . Painel do coronavirus do Ministério da Saúde do Brasil. Accessed May 13, 2022. https://covid.saude.gov.br/
- 3. Wolf JM, Streck AF, Fonseca A, Ikuta N, Simon D, Lunge VR. Dissemination and evolution of SARS‐CoV‐2 in the early pandemic phase in South America. J Med Virol. 2021a;93(7):4496‐4507. 10.1002/jmv.26967 [DOI] [PMC free article] [PubMed] [Google Scholar]
- 4. Wolf JM, Kipper D, Borges GR, Streck AF, Lunge VR. Temporal spread and evolution of SARS‐CoV‐2 in the second pandemic wave in Brazil. J Med Virol. 2021;10:27371‐27936. 10.1002/jmv.27371 [DOI] [PMC free article] [PubMed] [Google Scholar]
- 5. COVID‐19 Excess Mortality Collaborators . Estimating excess mortality due to the COVID‐19 pandemic: a systematic analysis of COVID‐19‐related mortality, 2020‐21. Lancet. 2022;399(10334):1513‐1536. 10.1016/S0140-6736(21)02796-3 [DOI] [PMC free article] [PubMed] [Google Scholar]
- 6. Nogales Vasconcelos AM, Ishitani L, Abreu DMX, França E. Covid adult mortality in Brazil: an analysis of multiple causes of death. Front Public Health. 2022;9:788932. 10.3389/fpubh.2021.788932 [DOI] [PMC free article] [PubMed] [Google Scholar]
- 7. Phillips MC, Sarff L, Banerjee J, et al. Effect of mortality from COVID‐19 on inpatient outcomes. J Med Virol. 2022;94(1):318‐326. 10.1002/jmv.27332 [DOI] [PMC free article] [PubMed] [Google Scholar]
- 8. Strålin K, Wahlström E, Walther S, et al. Mortality in hospitalized COVID‐19 patients was associated with the COVID‐19 admission rate during the first year of the pandemic in Sweden. Infect Dis (Lond). 2022;54(2):145‐151. 10.1080/23744235.2021.1983643 [DOI] [PubMed] [Google Scholar]
- 9. Zeiser FA, Donida B, da Costa CA, et al. First and second COVID‐19 waves in Brazil: a cross‐sectional study of patients' characteristics related to hospitalization and in‐hospital mortality. Lancet Reg Health Am. 2022;6:100107. 10.1016/j.lana.2021.100107 [DOI] [PMC free article] [PubMed] [Google Scholar]
- 10. Adamoski D, Baura VA, Rodrigues AC, et al. SARS‐CoV‐2 delta and omicron variants surge in curitiba, Southern Brazil, and its impact on overall COVID‐19 lethality. Viruses. 2022;14(4):809. 10.3390/v14040809 [DOI] [PMC free article] [PubMed] [Google Scholar]
- 11. Alcantara LCJ, Nogueira E, Shuab G, et al. SARS‐CoV‐2 epidemic in Brazil: how variants displacement have driven distinct epidemic waves. Virus Res. 2022;315:198785. 10.1016/j.virusres.2022.198785 [DOI] [PMC free article] [PubMed] [Google Scholar]
- 12. Silva ARD, Jr. , Villas‐Boas LS, Tozetto‐Mendoza TR, et al. Generation of neutralizing antibodies against omicron, gamma and delta SARS‐CoV‐2 variants following CoronaVac vaccination. Rev Inst Med Trop Sao Paulo. 2022;64:e19. 10.1590/S1678-9946202264019 [DOI] [PMC free article] [PubMed] [Google Scholar]
- 13. Grasselli G, Greco M, Zanella A, et al. Risk factors associated with mortality among patients with COVID‐19 in intensive care units in lombardy, Italy. JAMA Intern Med. 2020;180(10):1345‐1355. 10.1001/jamainternmed.2020.3539 [DOI] [PMC free article] [PubMed] [Google Scholar]
- 14. Richardson S, Hirsch JS, Narasimhan M, et al. Presenting characteristics, comorbidities, and outcomes among 5700 patients hospitalized with COVID‐19 in the New York city area. JAMA. 2020;323(20):2052‐2059. 10.1001/jama.2020.6775 [DOI] [PMC free article] [PubMed] [Google Scholar]
- 15. Peixoto SG, Wolf JM, Glaeser AB, Maccari JG, Nasi LA. Longer length of stay, days between discharge/first readmission, and pulmonary involvement ≥50% increase prevalence of admissions in ICU in unplanned readmissions after COVID‐19 hospitalizations. J Med Virol. 2022;4:3750‐3756. 10.1002/jmv.27792 [DOI] [PMC free article] [PubMed] [Google Scholar]
- 16. Atalla E, Kalligeros M, Giampaolo G, Mylona EK, Shehadeh F, Mylonakis E. Readmissions among patients with COVID‐19. Int J Clin Pract. 2021;75(3):e13700. 10.1111/ijcp.13700 [DOI] [PubMed] [Google Scholar]
- 17. Donnelly JP, Wang XQ, Iwashyna TJ, Prescott HC. Readmission and death after initial hospital discharge among patients with COVID‐19 in a large multihospital system. JAMA. 2021;325(3):304‐306. 10.1001/jama.2020.21465 [DOI] [PMC free article] [PubMed] [Google Scholar]
- 18. Chalmers JD. ICU admission and severity assessment in community‐acquired pneumonia. Crit Care. 2009;13(3):156. 10.1186/cc7889 [DOI] [PMC free article] [PubMed] [Google Scholar]
- 19. Mehta P, McAuley DF, Brown M, Sanchez E, Tattersall RS, Manson JJ. HLH across speciality collaboration, UK. COVID‐19: consider cytokine storm syndromes and immunosuppression. Lancet. 2020;395(10229):1033‐1034. 10.1016/S0140-6736(20)30628-0 [DOI] [PMC free article] [PubMed] [Google Scholar]
- 20. Rokadiya S, Gil E, Stubbs C, Bell D, Herbert R. COVID‐19: outcomes of patients with confirmed COVID‐19 re‐admitted to hospital. J Infect. 2020;81(3):e18‐e19. 10.1016/j.jinf.2020.07.007 [DOI] [PMC free article] [PubMed] [Google Scholar]
- 21. Ruan Q, Yang K, Wang W, Jiang L, Song J. Clinical predictors of mortality due to COVID‐19 based on an analysis of data of 150 patients from Wuhan, China. Intensive Care Med. 2020;46(5):846‐848. 10.1007/s00134-020-05991-x [DOI] [PMC free article] [PubMed] [Google Scholar]
- 22. Jesem Douglas Yamall Orellana, Lihsieh Marrero, Bernardo Lessa. Horta . (2021). letalidade hospitalar por COVID‐19 em quatro capitais brasileiras e sua possível relação temporal com a variante gama, 2020‐2021. Epidemiol. Serv. Saúde. 2021;30(4):e2021709. 10.1590/s1679-49742021000400024 [DOI] [PubMed] [Google Scholar]
- 23. Fundação Oswaldo Cruz . Nota técnica, MonitoraCovid‐19 – ICICT/FIOCRUZ. Accessed June 06, 2022. Available: https://bigdata-covid19.icict.fiocruz.br/nota_tecnica_24.pdf
Associated Data
This section collects any data citations, data availability statements, or supplementary materials included in this article.
Data Availability Statement
The data that support the findings of this study are available from the corresponding author upon reasonable request.


