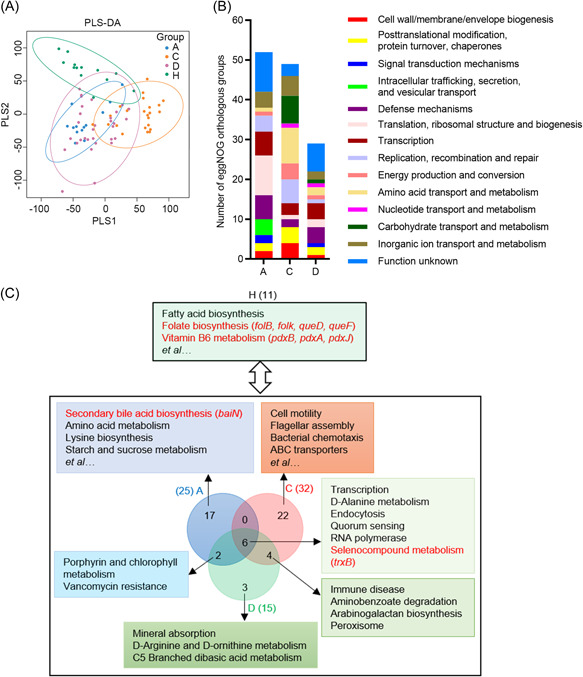
Figure 4.

Microbial functional pathways enriched in COVID‐19‐related and control groups, The functional profiling of gut microbiota in COVID‐19‐related and healthy groups based on eggNOG and KO annotation. (A) Partial least‐squares discriminant analysis (PLS‐DA) ordination in Groups A, C, D, and H according to eggNOG annotations. (B) Number of enriched eggNOG orthologous groups in Groups A, C, and D compared with Group H (linear discriminant analysis effect size (LEfSe) analysis, LDA score > 2, p < 0.05). There were 53, 49, and 29 enriched eggNOG orthologous groups in Groups A, C, and D, respectively. (C) Enriched microbial functional pathways in Groups A, C, D, and H based on KO annotations (LEfSe analysis, LDA score > 2, p < 0.05). There were 25, 32, 15, and 11 enriched functional pathways in Groups A, C, D, and H, respectively. Six enriched pathways were shared by three COVID‐19 groups, two were shared by Groups A and D, and four were shared by Groups C and D. The enriched genes and pathways are formatted in red font.
