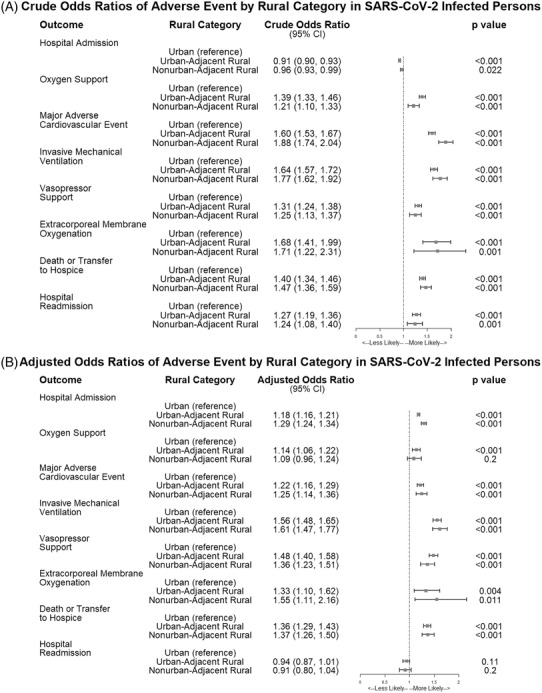
FIGURE 3.

Forest plot showing the crude and adjusted odds ratios for adverse events by rural category in SARS‐CoV‐2‐infected persons in N3C, January 2020‐June 2021. Figure 3 shows the crude (A) and adjusted (B) odds ratios for being hospitalized, dying or being transferred to hospice after hospitalization, requiring any inpatient oxygen support, having a major adverse cardiovascular event, requiring invasive mechanical ventilation, requiring extracorporeal membrane oxygenation, or having a hospital readmission after initial hospitalization in the SARS‐CoV‐2‐infected population in N3C by rural category. Risk is similar between adjusted and unadjusted models, suggesting a real impact of rurality on adverse events. Adjusted models include adjustments for gender, race, ethnicity, BMI category, age, Charlson Comorbidity Index (CCI) composite score, rurality, quarter of diagnosis, and Census subregion. Data provider is included as a random effect in the adjusted models to account for differences across source data systems
