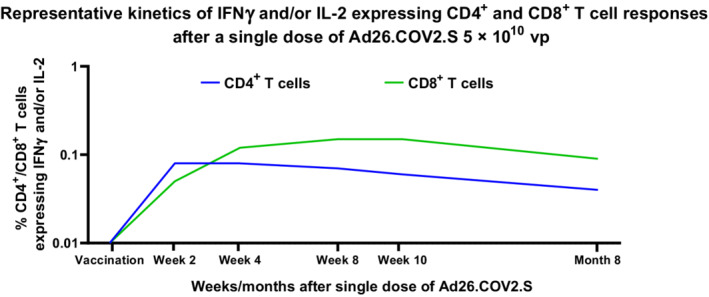
FIGURE 3.

Representative kinetics of IFNγ and/or IL‐2 expressing CD4+ and CD8+ T‐cell responses after a single dose of Ad26.COV2.S 5 × 10¹⁰ vp. Participants aged 18‐55 years (N = ~40) and ≥65 years (N = ~40) in a phase 1/2a trial were given a single dose of Ad26.COV2.S (5 × 10¹⁰ vp) at Day 1, as primary vaccination. S‐specific T‐cell responses were measured at baseline and on Day 15 by intracellular cytokine staining in a subset of participants. In CD4+ and CD8+ T cells, a response was characterized by the expression of IFNγ or IL‐2 (or both). CD4+ and CD8+ T‐cell responses are indicated by blue and green lines, respectively. CD, cluster of differentiation; IFNγ, interferon gamma; IL, interleukin; vp, viral particles
