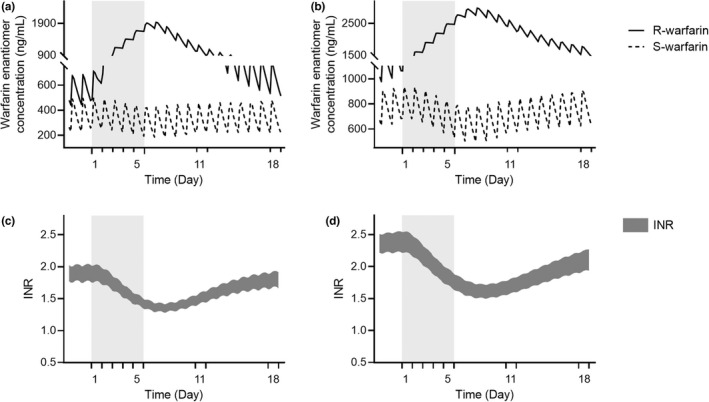
Figure 2.

Plasma concentration profile of warfarin enantiomers (a, b) and INR profile (c, d) over time in the general population (20–65 years) a and c and geriatric subjects (65–85 years) b and d. Racemic warfarin daily dose of 5 mg was simulated. Gray background represents 5‐days treatment of ritonavir of 100 mg twice daily. Data are presented as mean value. INR, international normalized ratio.
