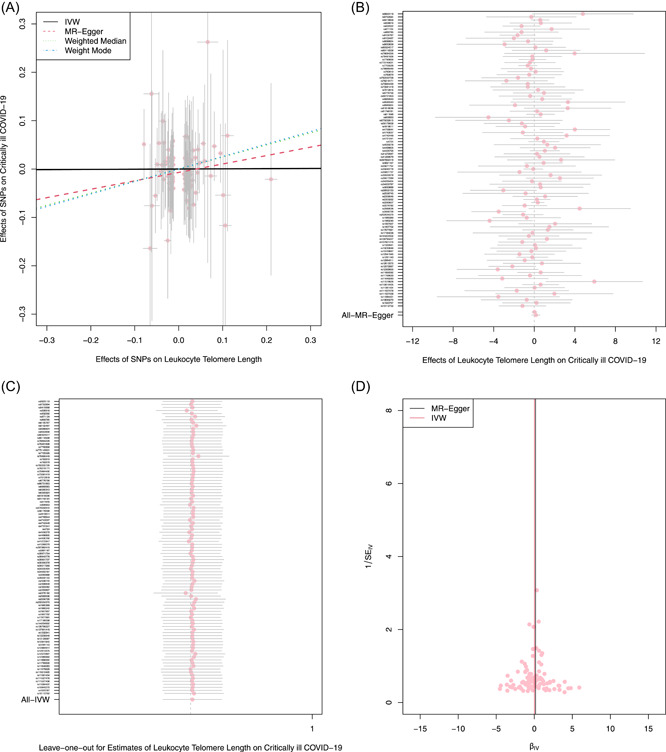
Figure 3.

The reverse MR analyses: Casual effect of LTL on critically ill COVID‐19. (A) Scatter plot of the association between critically ill COVID‐19 and LTL. The four methods applied in the current manuscript were all depicted. Lines in black, red, green, and blue represent IVW, MR‐Egger, weighted median, and weight mode methods. (B) A forest plot was used to show the MR estimate and 95% CI values (gray line segment) for each SNP, also show the IVW and MR‐Egger MR results at the bottom. (C) Leave‐one‐out analyses to evaluate whether any single instrumental variable was driving the causal effect. (D) A funnel plot was applied to detect whether the observed association was along with obvious heterogeneity. CI, confidence interval; IVW, inverse variance weighted; LTL, leukocyte telomere length; MR, Mendelian randomization; SNPs, single‐nucleotide polymorphisms.
