
FIGURE 1.
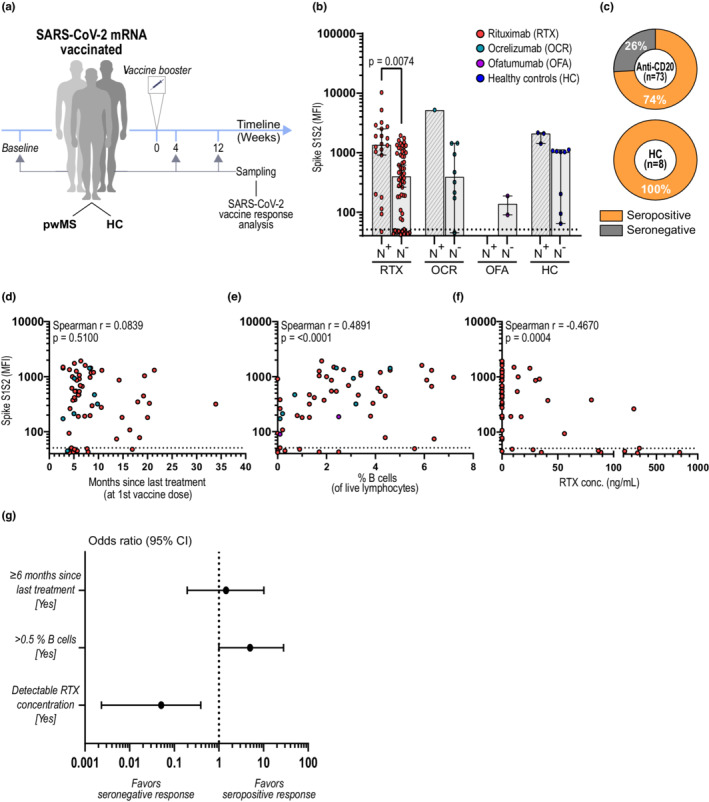
B‐cell and plasma rituximab (RTX) levels are better predictors of humoral response after SARS‐CoV‐2 vaccination than time since last anti‐CD20 treatment. (a) Study design. SARS‐CoV‐2 mRNA‐vaccinated individuals were sampled before (baseline) and/or 4 and/or 12 weeks after booster and analyzed for both SARS‐CoV‐2‐specific humoral and cellular responses. (b) Spike S1S2 antibody levels measured as median fluorescent intensity (MFI) 4 weeks after booster. Spike S1S2 antibody levels in COVID‐19‐recovered (N+) and naïvely vaccinated (N−) individuals are shown: RTX N+ (n = 20), N− (n = 62); OCR N+ (n = 1), N− (n = 9); OFA N+ (n = 0), N− (n = 2); HC N+ (n = 3), N− (n = 8). (c) Proportion of seropositivity 4 weeks after booster in naïvely vaccinated persons with multiple sclerosis (pwMS) on anti‐CD20 treatment (n = 73) and in HC (n = 8). (d–f) Correlations between antibody levels and (d) months since last treatment (at first vaccine dose), (e) percentages of B cells (of live lymphocytes), and (f) RTX concentration in plasma, all measured at 4 weeks after booster. (g) Forest plot showing the effect of time since last treatment, percentages of B cells, and detectable RTX concentration in plasma on seroconversion after SARS‐CoV‐2 mRNA vaccination in pwMS treated with RTX (n = 55). Dots represent individual data points. Box plots represent median and 95% confidence interval (CI). Dotted lines indicate cutoff value for antibody positivity. Kruskal–Wallis test with Dunn post hoc multiple comparison test was used for statistical analysis, and p‐values < 0.05 were considered significant. Spearman r and p‐values are shown. Multiple logistic regression analysis was used for prediction of seroconversion