
FIGURE 3.
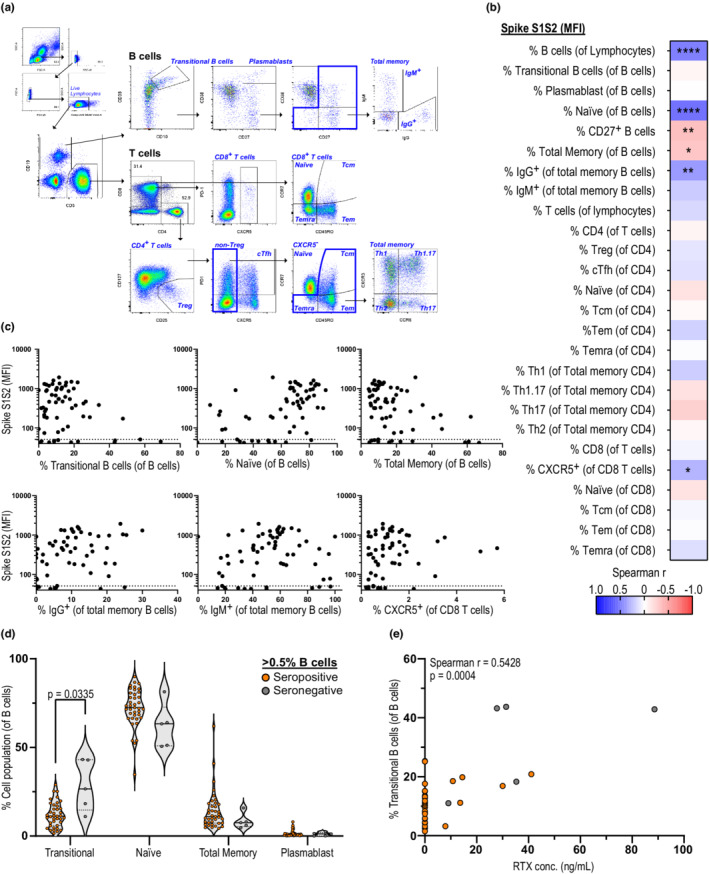
SARS‐CoV‐2 antibody levels correlate with percentages of B‐cell subpopulations. (a) Exemplar gating strategy for flow cytometry staining of B‐ and T‐cell populations. (b) Correlation matrix with Spearman r between spike S1S2 antibody levels (median fluorescent intensity [MFI]) and different B‐ and T‐cell subpopulations in persons with multiple sclerosis (pwMS) on anti‐CD20 4 weeks after booster (n = 62). (c) Individual correlations of spike S1S2 antibody levels and B‐ and T‐cell subpopulations of interest, as in b. (d) Percentages of B‐cell subpopulations (of total B cells) in pwMS with B‐cell levels > 0.5% 4 weeks after booster in seropositive (n = 34) and seronegative (n = 5) individuals. (e) Correlation of transitional B cells with rituximab (RTX) concentration in pwMS 4 weeks after booster (n = 39). Dots represent individual data points. Dotted lines indicate cutoff value for antibody positivity. Correlations analyzed using Spearman r and p‐values are shown: *p < 0.05, **p < 0.01, ****p < 0.0001. Mann–Whitney test with Holm–Šídák adjustments was used for statistical analysis between seropositive and seronegative donors, and adjusted p‐values < 0.05 were considered significant. cTfh, circulating T follicular helper cells; Tcm, central memory T cells; Tem, effector memory T cells; Temra, terminally differentiated effector memory T cells; Th, T helper cells; Treg, regulatory T cells