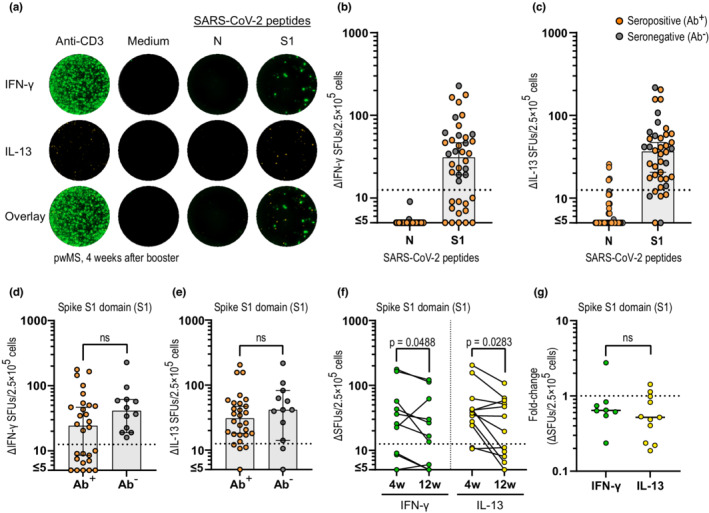
FIGURE 5.

Development of SARS‐CoV‐2 specific T‐cell response in anti‐CD20‐treated persons with multiple sclerosis (pwMS) after vaccination. (a) Representative images of the interferon‐γ (IFN‐γ)/interleukin‐13 (IL‐13) FluoroSpot after stimulation with the positive control (anti‐CD3), negative control (medium only), and SARS‐CoV‐2‐specific peptides (N and S1) in one naïvely vaccinated pwMS 4 weeks after booster (4w). (b, c) Serology status and IFN‐γ (b) and IL‐13 (c) response after stimulation with SARS‐CoV‐2‐specific peptides (N and S1) 4 weeks after booster in naïvely vaccinated pwMS (n = 40). (d, e) Comparison of the IFN‐γ (d) and IL‐13 (e) response between seropositive (Ab+, n = 28) and seronegative (Ab−, n = 12) individuals 4 weeks after booster. (f) Number of IFN‐γ and IL‐13 delta‐spot forming units (ΔSFUs) 4 and 12 weeks after booster (12w) in pwMS on anti‐CD20 (n = 12). (g) Fold‐change in ΔSFUs between 4 and 12 weeks in pwMS with a response to IFN‐γ (n = 7) and IL‐13 (n = 10) above cutoff at 4 weeks after booster. Dots represent individual data points. Box plots represent median and 95% confidence interval. Dotted lines indicate cutoff value for T‐cell‐positive samples. Mann–Whitney and Wilcoxon matched‐pairs signed rank test was used for statistical analyses, and p‐values < 0.05 were considered significant. 4w, 4 weeks after booster; 12w, 12 weeks after booster; Ab, antibody; ns, not significant
