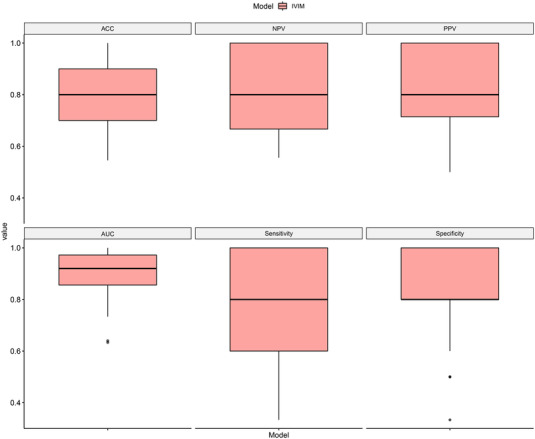
FIGURE 8.

Boxplot of 100‐times repeated dataset randomly split evaluation results for the Combined model in independent test set. The details statistical results of receiver operating characteristic curve (ROC) metrics showed as follows: AUC = 0.9099±0.0856; ACC = 0.7974±0.1188; sensitivity = 0.7733±0.1910; specificity = 0.8213±0.1462; PPV = 0.8173±0.1362; NPV = 0.8106±0.1445. AUC, area under curve; ACC, accuracy; NPV, negative predicted value; PPV, positive predicted value
