
FIGURE 1.
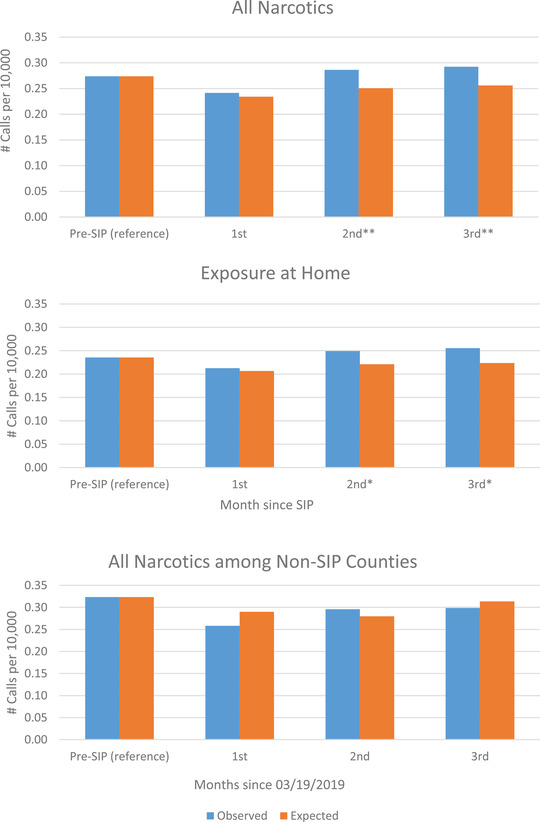
Rates of exposure to controlled substances among rural counties by month since SIP and exposure site. Data Source: AAPCC; estimated via Poisson regression model; *P < .1; **P < .05.
Official websites use .gov
A
.gov website belongs to an official
government organization in the United States.
Secure .gov websites use HTTPS
A lock (
) or https:// means you've safely
connected to the .gov website. Share sensitive
information only on official, secure websites.
Rates of exposure to controlled substances among rural counties by month since SIP and exposure site. Data Source: AAPCC; estimated via Poisson regression model; *P < .1; **P < .05.