
Figure 6.
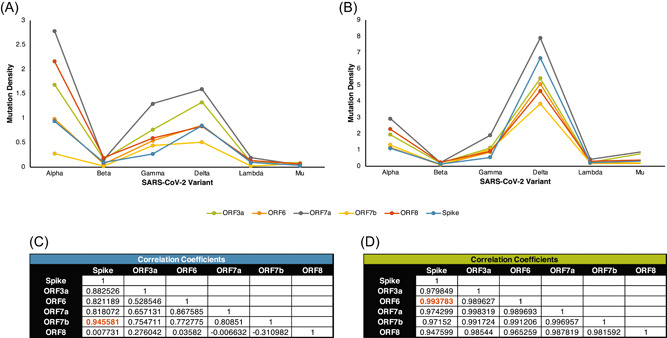
Comparison of mutation densities between SARS‐CoV‐2 accessory proteins and the Spike protein. The mutation densities of each accessory protein per variant were compared across the early (A) and late (B) time points. The correlation coefficient between the accessory and Spike proteins was calculated in both the early (C) and late (D) time points.