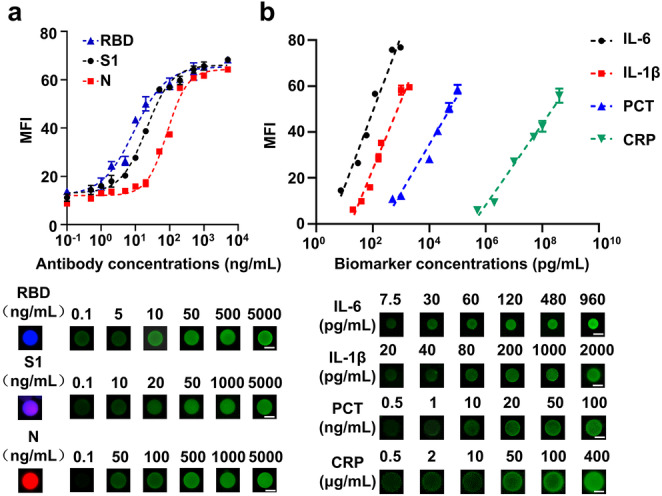
Figure 2.

Quantification of antibodies and biomarkers based on dual‐encoded beads immunoassay. a) Analytical dose‐response curves and fluorescence images for detection of anti‐RBD/S1/N antibodies based on color‐encoded beads. Scale bars: 10 μm. b) Linear detection range and fluorescence images for detection of IL‐6, IL‐1β, PCT, CRP based on size‐encoded beads. Scale bars: 10 μm. The error bars represent the standard deviation of three measurements (n=3).
