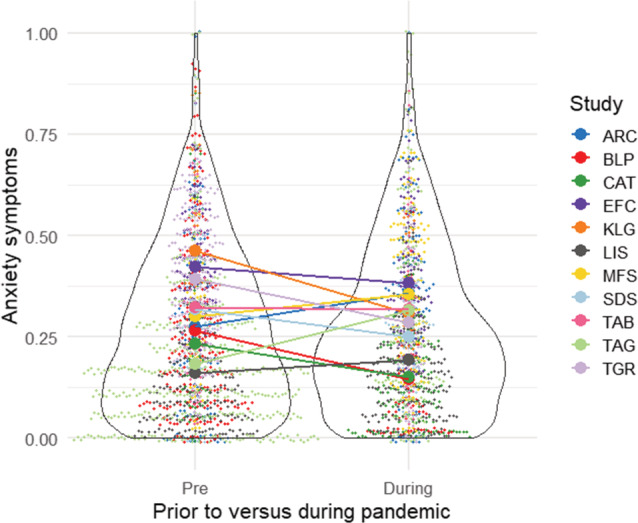
FIGURE 2.

Anxiety symptoms prior to and during the pandemic in proportion of maximum score. Colors indicate which study the individual data points belonged to and the bigger dots depict means of each study at each time point, connected by a line. Note that jitter was added to visualize overlapping data points.
