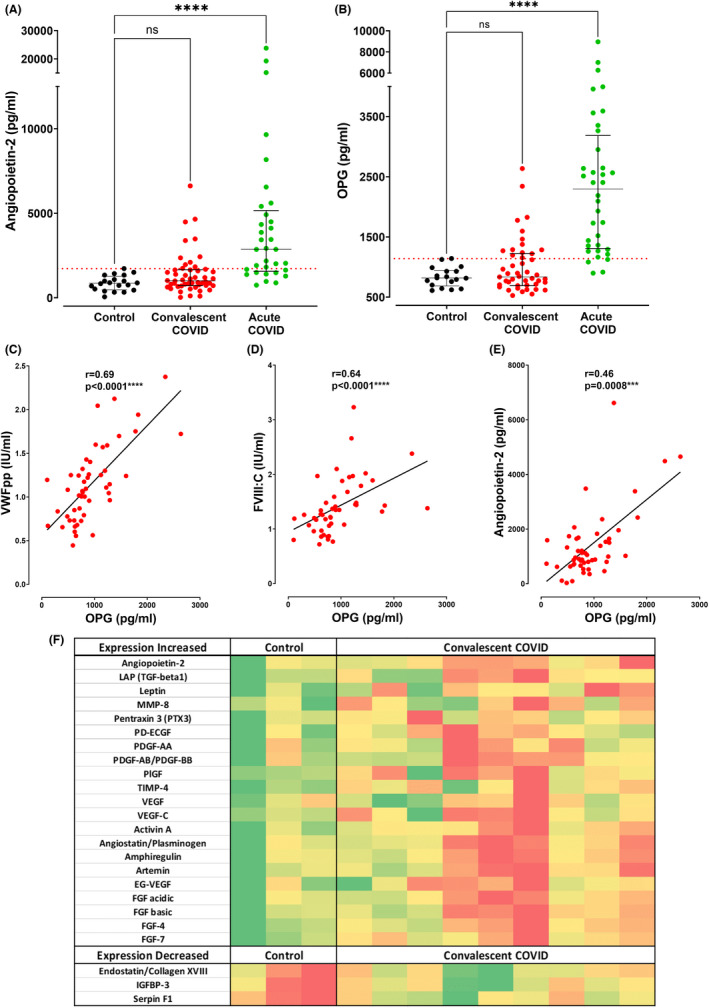
FIGURE 2.

Comparisons are shown between acute COVID‐19 patients (n = 36), convalescent COVID‐19 patients (n = 50), and healthy controls (n = 20) including: (A) plasma Angiopoietin‐2 (Ang‐2) levels, and (B) plasma Osteoprotegerin (OPG) levels. Dotted red lines denote the upper limit of the local reference range for plasma Ang‐2 and OPG. Data are presented as median and the interquartile range. Comparisons between groups were assessed using the Kruskal‐Wallis test. Correlations are shown between plasma levels of OPG and endothelial cell activation parameters including: (C) von Willebrand factor propeptide (VWFpp), (D) Factor VIII:C, and (E) Angiopoietin‐2. Correlations were evaluated using the Spearman rank correlation test. (F) Heatmap visualization indicating angiogenesis‐related protein expression detected in each subject (columns) for each protein (rows), comparing a subset of convalescent COVID‐19 patients (n = 9, 6/9 males) and healthy controls (n = 3, 2/3 males). This subset of convalescent patients and controls were selected to match the age and sex profile of the overall convalescent cohort. Protein levels were measured via membrane‐based antibody array and data are represented by mean pixel intensity with red indicating higher and green indicating lower levels of the protein of interest. Comparisons between groups were assessed using the Mann–Whitney U test.(ns = not significant, ***p <0 .001, ****p <0 .0001).
