FIGURE 4.

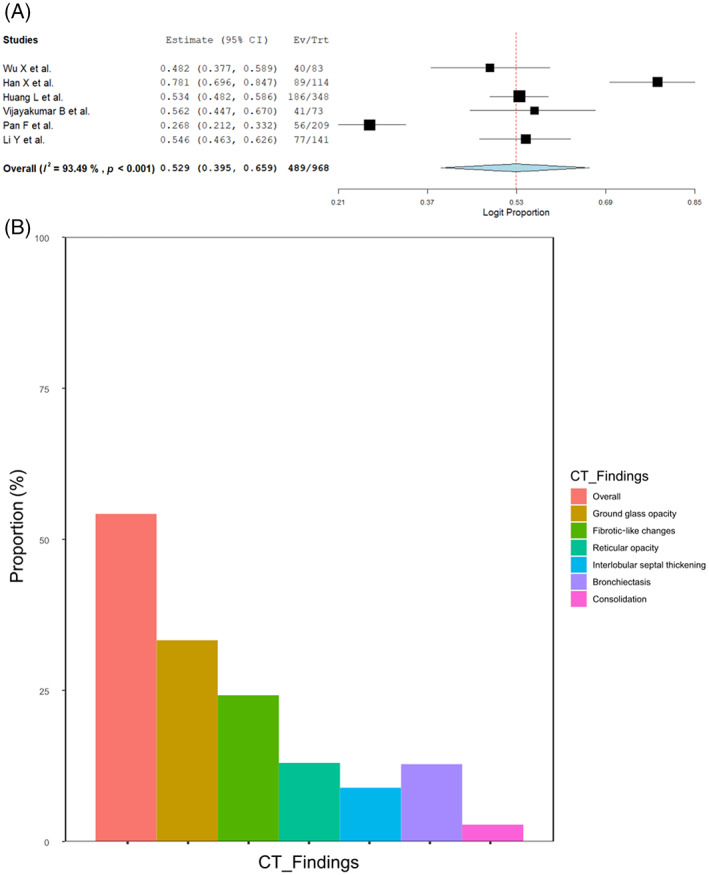
(A) Forest plots of overall residual computed tomography (CT) abnormalities at mid‐term follow‐up. (B) Bar graph showing the residual CT abnormalities at mid‐term follow‐up

(A) Forest plots of overall residual computed tomography (CT) abnormalities at mid‐term follow‐up. (B) Bar graph showing the residual CT abnormalities at mid‐term follow‐up