
Figure 4.
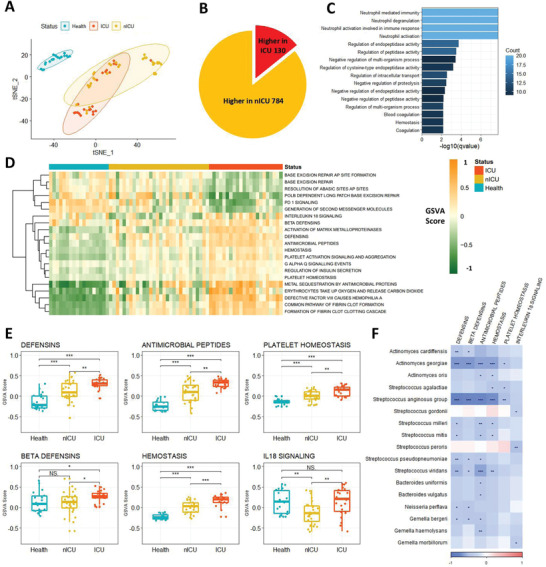
Defensin‐related pathways in PBMCs were increased in patients with COVID‐19 and associated with respiratory tract microbiota. A) Clusters of healthy donors and patients with COVID‐19 based on tSNE clustering. B) DEGs between ICU (n = 20) and nICU (n = 28) patients. C) Significantly enriched GO function terms based on up‐regulated DEGs in ICU patients. D) GSEA score of the pathways based on REACTOME database for each patient. E) Defensin‐ and hemostasis‐related pathways were up‐regulated in ICU patients compared with nICU patients F) Relationship between pathway GSEA score and microbial relative abundances at the species level. The color in the heatmap represents the correlation coefficients estimated by Spearman correlation analysis. * p < 0.05, ** p < 0.01, *** p < 0.001. ICU: intensive care unit; nICU: non‐ICU; tSNE: t‐distributed stochastic neighbor embedding; DEGs: differentially expressed genes; GO: gene ontology; GSEA: gene set enrichment analysis; centerline, median; box limits, upper and lower quartiles; error bars, 95% CI.